INVITE-ONLY SCRIPT
已更新 Gamma Exposure
Overview:
Gamma is part of the second order of greeks which measure the sensitivity of first order greeks (Delta) to changes in factors of the underlying. Using Gamma, traders can see the potential delta hedging activity by market makers. If market makers are long gamma, they will be buying as price decreases and selling as price increases, which acts as a stabilizing factor on the market. If they are short gamma, they are buying as price increases and selling as price decreases, which can further intensify volatility.
How it works/Calculations:
This indicator will bring the data from an outside source and will calculate Gamma from the Black-Scholes equation. Will take all the open contracts for the underlying and calculate Gamma exposure. A few assumptions will be made that may or may not be true, like making the assumptions that all open contracts were sold by the market maker. Although not perfect, will give an idea of where the market maker will be since the majority will be done by them.
The impact that Gamma has is dependent on different factors, such as open interest, time expiry, and volatility. The more open interest is at a strike that has near- term expiration date, the more likely is that the Gamma exposure will have an impact on the market. Gamma will work as a magnet and pins depending on strong levels.
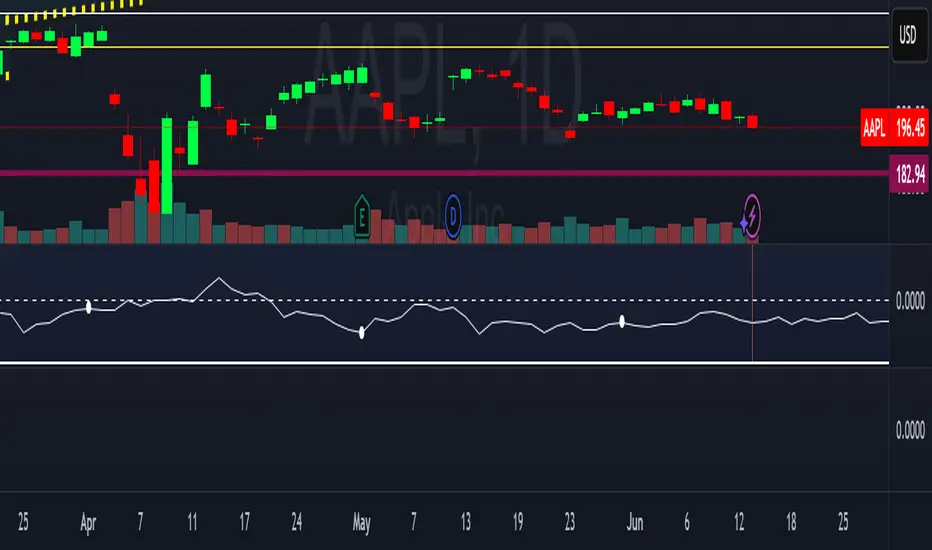
In the settings, you can choose to see both calls and put Gamma levels or just see the delta, meaning the difference between the calls and the puts. Since this is based on open Interest of the options contracts and those update once a day, this indicator will update once a day as well to give the most current values.
Current equities available for the data:
1. Spx 2. Spy 3. QQQ 4. IWM, 5. AAPL 6. MSFT 7. NVDA 8. AMD 9. V 10. Crm 11. Meta 12. Goog 13. NFLX 14. Amzn 15. Tsla 16. HD 17. Low 18. TGT 19. Wmt 20. XOM 21. Cvx 22. JPM 23. AXP 24. GS 25. ABBV 26. Cat 27. DE 28. BA 29. Fdx 30. UPS 31. Shop 32. SQ 33. Abnb 34. Snow 35. Coin 36. Crwd 37. Uber 38. SBUX 39. ENPH
How to use:
You should not be using this indicator for entries or stop. This indicator will help you see where there are possible levels that will serve as magnets or rejections or where price can be pinned.
Pitfalls:
Gamma is one of the second order greeks, there are other greeks that can also affect movement by the market makers. Time to expiry, volatility and open interest impact gamma. We are calculating all open interest as the market maker being the originator of it. Large and elevated exposure in groups of strikes is more likely to be significant than individual smaller strikes.
Disclaimer:
This is still an indicator that in no way should be used alone.
The information contained in this script does not constitute financial advice or a solicitation to buy or sell any securities of any type. I will not accept liability for any loss or damage, including without limitation any loss of profit, which may arise directly or indirectly from the use of or reliance on such information.
All investments involve risk, and the past performance of a security, industry, sector, market, financial product, trading strategy, backtest, or individual's trading does not guarantee future results or returns. Investors are fully responsible for any investment decisions they make. Such decisions should be based solely on an evaluation of their financial circumstances, investment objectives, risk tolerance, and liquidity needs.
My Scripts are only for educational purposes!
Gamma is part of the second order of greeks which measure the sensitivity of first order greeks (Delta) to changes in factors of the underlying. Using Gamma, traders can see the potential delta hedging activity by market makers. If market makers are long gamma, they will be buying as price decreases and selling as price increases, which acts as a stabilizing factor on the market. If they are short gamma, they are buying as price increases and selling as price decreases, which can further intensify volatility.
How it works/Calculations:
This indicator will bring the data from an outside source and will calculate Gamma from the Black-Scholes equation. Will take all the open contracts for the underlying and calculate Gamma exposure. A few assumptions will be made that may or may not be true, like making the assumptions that all open contracts were sold by the market maker. Although not perfect, will give an idea of where the market maker will be since the majority will be done by them.
The impact that Gamma has is dependent on different factors, such as open interest, time expiry, and volatility. The more open interest is at a strike that has near- term expiration date, the more likely is that the Gamma exposure will have an impact on the market. Gamma will work as a magnet and pins depending on strong levels.
In the settings, you can choose to see both calls and put Gamma levels or just see the delta, meaning the difference between the calls and the puts. Since this is based on open Interest of the options contracts and those update once a day, this indicator will update once a day as well to give the most current values.
Current equities available for the data:
1. Spx 2. Spy 3. QQQ 4. IWM, 5. AAPL 6. MSFT 7. NVDA 8. AMD 9. V 10. Crm 11. Meta 12. Goog 13. NFLX 14. Amzn 15. Tsla 16. HD 17. Low 18. TGT 19. Wmt 20. XOM 21. Cvx 22. JPM 23. AXP 24. GS 25. ABBV 26. Cat 27. DE 28. BA 29. Fdx 30. UPS 31. Shop 32. SQ 33. Abnb 34. Snow 35. Coin 36. Crwd 37. Uber 38. SBUX 39. ENPH
How to use:
You should not be using this indicator for entries or stop. This indicator will help you see where there are possible levels that will serve as magnets or rejections or where price can be pinned.
Pitfalls:
Gamma is one of the second order greeks, there are other greeks that can also affect movement by the market makers. Time to expiry, volatility and open interest impact gamma. We are calculating all open interest as the market maker being the originator of it. Large and elevated exposure in groups of strikes is more likely to be significant than individual smaller strikes.
Disclaimer:
This is still an indicator that in no way should be used alone.
The information contained in this script does not constitute financial advice or a solicitation to buy or sell any securities of any type. I will not accept liability for any loss or damage, including without limitation any loss of profit, which may arise directly or indirectly from the use of or reliance on such information.
All investments involve risk, and the past performance of a security, industry, sector, market, financial product, trading strategy, backtest, or individual's trading does not guarantee future results or returns. Investors are fully responsible for any investment decisions they make. Such decisions should be based solely on an evaluation of their financial circumstances, investment objectives, risk tolerance, and liquidity needs.
My Scripts are only for educational purposes!
發行說明
Unfortunately script not working as intended. PLEASE DO NOT TRY TO GET ACCESS. IF WE CAN GET IT TO WORK WILL FIX IT.
僅限邀請腳本
僅作者批准的使用者才能訪問此腳本。您需要申請並獲得使用許可,通常需在付款後才能取得。更多詳情,請依照作者以下的指示操作,或直接聯絡ScanYourStrat。
TradingView不建議在未完全信任作者並了解其運作方式的情況下購買或使用腳本。您也可以在我們的社群腳本中找到免費的開源替代方案。
作者的說明
Not working at the moment. If we can make it work as intended will give instructions. Sorry.
免責聲明
這些資訊和出版物並非旨在提供,也不構成TradingView提供或認可的任何形式的財務、投資、交易或其他類型的建議或推薦。請閱讀使用條款以了解更多資訊。