OPEN-SOURCE SCRIPT
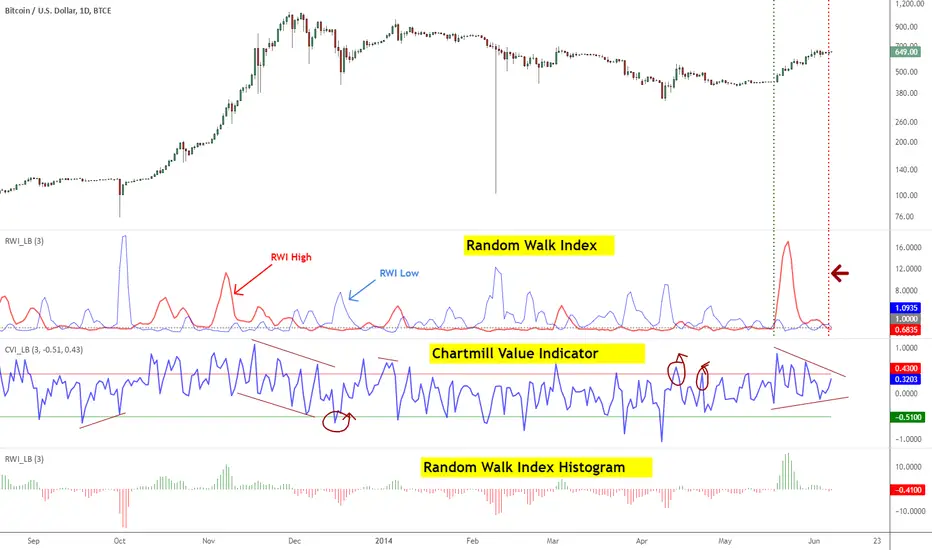
Indicators: Chartmill Value Indicator & Random Walk Index
ChartMill Value Indicator [CVI] & Modified ChartMill Value Indicator [MCVI]:
-------------------------------
Developed by Dirk Vandycke, CVI tracks how far the price spread is from its MA. Since MA keeps increasing even when price consolidates or stalls, it is very difficult for the deviation from a moving average to remain in the overbought or oversold regions for extended periods, which represents a significant improvement over other oscillators such as the RSI and Stochastic indicators.
However, a simple price spread from a moving average would not be comparable across all securities, which would preclude us from using the spread in systematic strategies. Fortunately, Mr.Vandycke addresses this problem by dividing the spread by the average true range, which is dependent on both the price level and volatility of the underlying security.
There is a variation of CVI called Modified CVI, which does time normalization of ATR (not the MA). This indicator supports displaying "Modified CVI" too. Check the options page.
This indicator is best used with other oscillators, to confirm signals. Zero line (in this case, "1" line since the gray line is drawn at the value of 1) crossovers should also be considered as signals.
I suggest tuning the OB/OS levels to match your instrument (usually it is around 0.5/-0.5 range).
More info:
traders.com/index.php?option=com_content&view=article&id=1914:the-chartmill-value-indicator&catid=48&Itemid=130
Random Walk Index [RWI]
-------------------------
RWI is used to determine if an issue is trending or in a random trading range (like ADX/Aroon). It attempts to do this by first determining an issue's trading range. The next step is to calculate a series of RWI indexes for the maximum look-back period. The largest index move in relation to a random walk is used as today's index.
Michael Poulos, inventor of RWI, recommends 2 to 7 for the short-term time frames and 8-64 for long terms. An issue is trending higher if the long term RWI of highs is greater than 1, while a downtrend is indicated if the long term RWI of lows is greater than 1.
Below are some more rules developed by Mr.Poulos:
- Enter a long (or close short) when the long-term RWI of the highs is greater than 1 and the short-term RWI of lows peaks above 1
- Enter short (or close long) when the long-term RWI of the lows is greater than 1 and the short-term RWI of highs peaks above 1
More info:
- tradingsim.com/blog/random-walk-index/
For displaying only the histogram (as shown in the bottom pane), select "ShowOnlyHistogram" in the options page.
開源腳本
本著TradingView的真正精神,此腳本的創建者將其開源,以便交易者可以查看和驗證其功能。向作者致敬!雖然您可以免費使用它,但請記住,重新發佈程式碼必須遵守我們的網站規則。
List of my free indicators: bit.ly/1LQaPK8
List of my indicators at Appstore: blog.tradingview.com/?p=970
List of my indicators at Appstore: blog.tradingview.com/?p=970
免責聲明
這些資訊和出版物並不意味著也不構成TradingView提供或認可的金融、投資、交易或其他類型的意見或建議。請在使用條款閱讀更多資訊。