PROTECTED SOURCE SCRIPT
SwingCPR
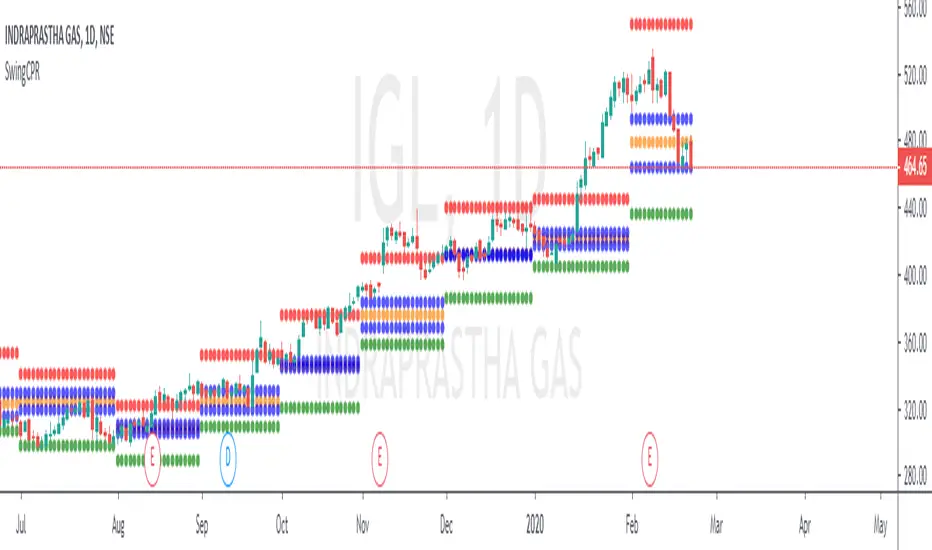
The above indicators is based on Central Pivot Range,
Details as to how to use it.
1.Strictly use 1D timeframe for analysis, sometimes you can use 1hr tf too.
2. R1(Redline) and S1(greenline) acts as resistance and support.
When you see a trending stock, you can always buy when the stock retraces to the CPR range with R1 as first target and vice versa.
受保護腳本
此腳本以閉源形式發佈。 不過,您可以自由使用,沒有任何限制 — 點擊此處了解更多。
Follow My Youtube Channel The Madras Trader youtube.com/channel/UCqxH7wzv-sMrCnjP3lM3Nmw/videos?view_as=subscriber
免責聲明
這些資訊和出版物並非旨在提供,也不構成TradingView提供或認可的任何形式的財務、投資、交易或其他類型的建議或推薦。請閱讀使用條款以了解更多資訊。
受保護腳本
此腳本以閉源形式發佈。 不過,您可以自由使用,沒有任何限制 — 點擊此處了解更多。
Follow My Youtube Channel The Madras Trader youtube.com/channel/UCqxH7wzv-sMrCnjP3lM3Nmw/videos?view_as=subscriber
免責聲明
這些資訊和出版物並非旨在提供,也不構成TradingView提供或認可的任何形式的財務、投資、交易或其他類型的建議或推薦。請閱讀使用條款以了解更多資訊。