PROTECTED SOURCE SCRIPT
已更新 Special Candle Setup
The Special Candle Setup Indicator is designed to detect significant bearish and bullish candlestick patterns, helping traders identify potential trend shifts and key price action setups. This indicator recognizes 8 bearish patterns and 6 bullish patterns, derived from multi-candlestick formations observed across different markets, including crypto, indices, forex, and stocks.
How It Works
This indicator scans the market for specific candlestick structures that indicate potential reversals or trend continuations. It includes:
• Bearish Patterns (8 types): Identifies candlestick structures that suggest potential downside movement.
• Bullish Patterns (6 types): Detects formations indicating upward momentum.
• Reversal Signals: Additional patterns that highlight key turning points in price action.
• Key Level Marking: Automatically draws support and resistance levels based on detected setups.
• Expiry Signals (Optional): Highlights patterns commonly seen on expiry days in the Indian market, but these patterns are universally applicable to other asset classes as well.
Key Features
✔ Comprehensive Candlestick Pattern Recognition – Detects 14 key bullish and bearish formations.
✔ Reversal & Trend Continuation Setups – Helps identify both potential reversals and momentum-based entries.
✔ Automated Key Level Marking – Plots dynamic blue lines for key support and resistance zones.
✔ Customizable Pattern Selection – Allows users to enable/disable specific pattern types.
✔ Non-Repainting Signals – Ensures stability by maintaining signal integrity over time.
Customization Options
• Enable/Disable Specific Patterns – Users can disable main patterns or reversal patterns based on their preference, allowing them to focus on a single type of setup if needed.
• Key Level Customization – The blue lines represent critical price levels, drawn automatically based on identified patterns. These act as reference points for potential breakouts or reversals.
• Optional Expiry Signals – Includes patterns commonly observed on expiry days, primarily for the Indian market, but they also appear in global markets like crypto, forex, and indices.
How to Use
• Trend Trading – Use bullish and bearish patterns to identify entry points within an existing trend.
• Reversal Trading – Focus on reversal signals near key levels for potential market turnarounds.
• Key Level Validation – Utilize the blue lines to confirm important price zones.
• Customization – Tailor the indicator to your strategy by selecting only the patterns that align with your trading style.
Why This Combination?
This indicator blends multiple candlestick formations, ensuring a well-rounded approach to market analysis. The integration of expiry signals, reversal structures, and key level plotting makes it adaptable for various asset classes, not just expiry-based trading.
Why It’s Worth Using?
Manually spotting multiple candlestick setups can be time-consuming and subjective. This indicator automates the process, providing structured insights into market movements with clearly defined signals and key level plotting, making it valuable for traders across different markets.
發行說明
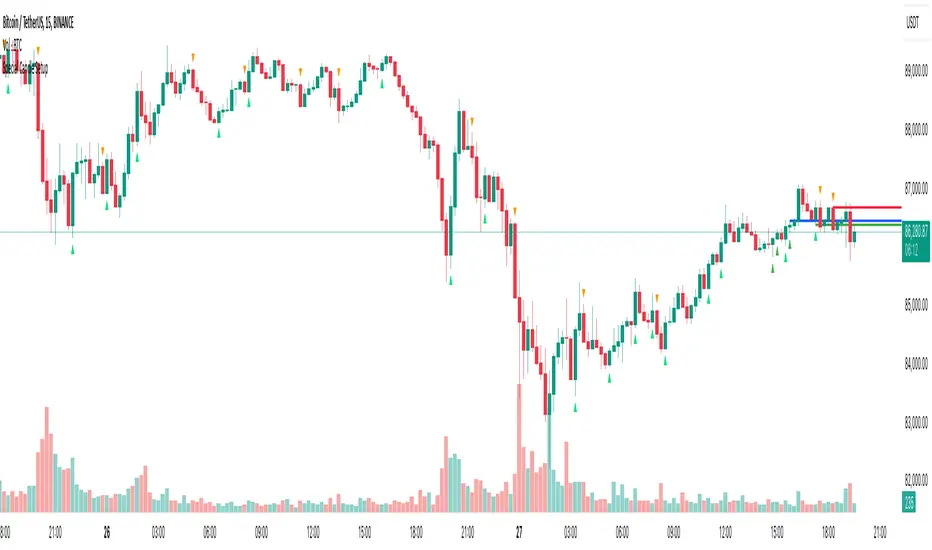
UPDATES.....🔹 “Updated expiry pattern detection for more precise Buy/Sell signals while keeping reversal signals independent.”
🔹 “Improved key level plotting: Blue Line (Expiry), Red Line (Bearish Reversal), Green Line (Bullish Reversal) are now clearly defined.”
🔹 “Chart remains cleaner with optimized line deletion and updated signal logic.”
發行說明
UPDATE MISSED THE CHART, UPDATING IT NOW受保護腳本
此腳本以閉源形式發佈。 不過,您可以自由使用,沒有任何限制 — 點擊此處了解更多。
Thanks.
TradeTech Analysis
Telegram Channel - t.me/Tradetech2024
Youtube Channel - youtube.com/@TradeTechAnalysis
Website - tradetechanalysis.com/
Super Profile - superprofile.bio/tradetechanalysis
TradeTech Analysis
Telegram Channel - t.me/Tradetech2024
Youtube Channel - youtube.com/@TradeTechAnalysis
Website - tradetechanalysis.com/
Super Profile - superprofile.bio/tradetechanalysis
免責聲明
這些資訊和出版物並非旨在提供,也不構成TradingView提供或認可的任何形式的財務、投資、交易或其他類型的建議或推薦。請閱讀使用條款以了解更多資訊。
受保護腳本
此腳本以閉源形式發佈。 不過,您可以自由使用,沒有任何限制 — 點擊此處了解更多。
Thanks.
TradeTech Analysis
Telegram Channel - t.me/Tradetech2024
Youtube Channel - youtube.com/@TradeTechAnalysis
Website - tradetechanalysis.com/
Super Profile - superprofile.bio/tradetechanalysis
TradeTech Analysis
Telegram Channel - t.me/Tradetech2024
Youtube Channel - youtube.com/@TradeTechAnalysis
Website - tradetechanalysis.com/
Super Profile - superprofile.bio/tradetechanalysis
免責聲明
這些資訊和出版物並非旨在提供,也不構成TradingView提供或認可的任何形式的財務、投資、交易或其他類型的建議或推薦。請閱讀使用條款以了解更多資訊。