OPEN-SOURCE SCRIPT
RSI Divergences + Bollinger Bands
█ OVERVIEW
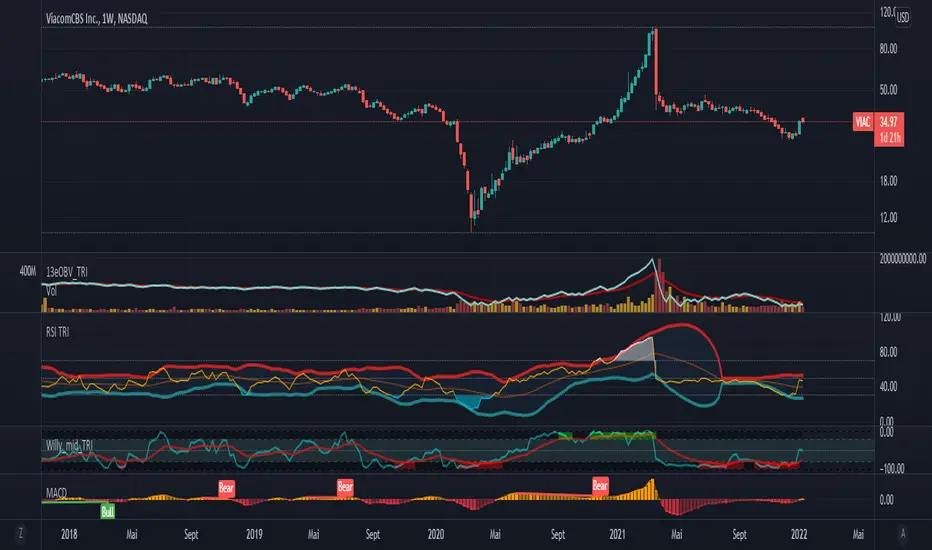
Here's the RSI divergences with Bollingers bands.
█ CONCEPTS
5 features
1 — RSI
2 — Bollinger bands
3 — RSI signal is in another color when above 70 or below 30
4 — Looking for previous Divergences, Bullish, Bearish and Hidden Bullish and Bearish but I don't like Hidden divergences
5 — Color fill when overbuy or oversold
█ OTHER SECTIONS
I like to see it like a moutain, with snow on top and lake on bottom. I think you don't want to start walking at the top, nor sink to the bottom of the lake for ever and ever.
It is an idea of sjoerd, tip him if you like it.
An oscillator is good to know where we are in the trends, but it's not enough to run a small business of trading, you need to learn how to use it.
What is a divergence ?
Thanks to The rational investor for teaching me how to use this indicator.
開源腳本
秉持TradingView一貫精神,這個腳本的創作者將其設為開源,以便交易者檢視並驗證其功能。向作者致敬!您可以免費使用此腳本,但請注意,重新發佈代碼需遵守我們的社群規範。
免責聲明
這些資訊和出版物並非旨在提供,也不構成TradingView提供或認可的任何形式的財務、投資、交易或其他類型的建議或推薦。請閱讀使用條款以了解更多資訊。
開源腳本
秉持TradingView一貫精神,這個腳本的創作者將其設為開源,以便交易者檢視並驗證其功能。向作者致敬!您可以免費使用此腳本,但請注意,重新發佈代碼需遵守我們的社群規範。
免責聲明
這些資訊和出版物並非旨在提供,也不構成TradingView提供或認可的任何形式的財務、投資、交易或其他類型的建議或推薦。請閱讀使用條款以了解更多資訊。