OPEN-SOURCE SCRIPT
TREND barcolors
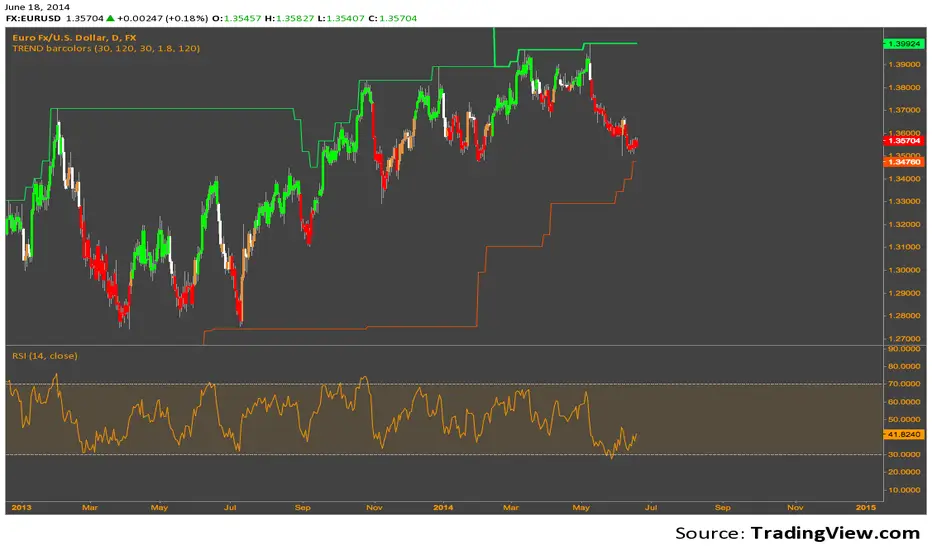
The Donchian values are basically from Ed Sekoytas original statistical run, that gave the values 30 & 120 (aren't as relevant today, but still packs a punch).
The idea of this code is just to take that 30, add a very simple inset of it, with ATR, and color code the bar Green or Red to indicate the direction of the trend. When a new break of the 120 line, (thick line) higher or lower, it typically indicates a bigger bias towards the trend.
It's my first publish, and so a very simple easy to understand system.
Use at your own risk. I cannot be held liable for any damages financial or otherwise, directly or indirectly related to using this script.
開源腳本
本著TradingView的真正精神,此腳本的創建者將其開源,以便交易者可以查看和驗證其功能。向作者致敬!雖然您可以免費使用它,但請記住,重新發佈程式碼必須遵守我們的網站規則。
免責聲明
這些資訊和出版物並不意味著也不構成TradingView提供或認可的金融、投資、交易或其他類型的意見或建議。請在使用條款閱讀更多資訊。
開源腳本
本著TradingView的真正精神,此腳本的創建者將其開源,以便交易者可以查看和驗證其功能。向作者致敬!雖然您可以免費使用它,但請記住,重新發佈程式碼必須遵守我們的網站規則。
免責聲明
這些資訊和出版物並不意味著也不構成TradingView提供或認可的金融、投資、交易或其他類型的意見或建議。請在使用條款閱讀更多資訊。