OPEN-SOURCE SCRIPT
Point and Figure on Candlestick Chart
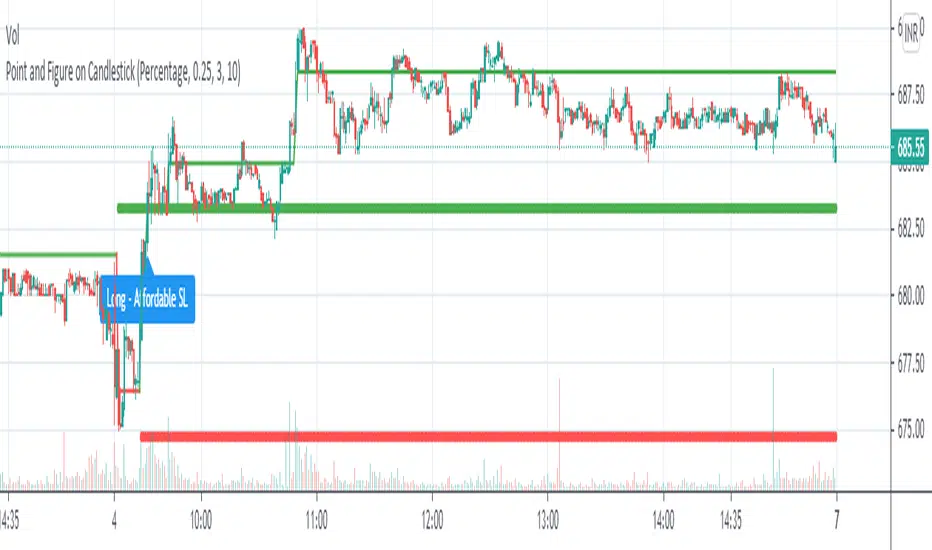
Live plotting of Point and Figure chart on a candlestick chart. With its own construction engine, it plot "X" and "O" column using a line chart. It plots the "X" column with green color and the "O" column with red color. Color of the line chart change from green to red when the column reversed from "X" to "O". It plot "Double Top Buy" and "Double Bottom Sell" level which help to do candlestick pattern analysis along with Point and Figure chart. Works on all timeframes with given parameters.
Options :
Box Size Assignment Method : Select a method to construct Point and Figure chart. There are two options "Fix" and "Percentage". The default value is "Percentage".
Box Size : The size of box. Minimum price movement to plot a new box. Smaller box size shows greater price movement and Bigger box size shows more filtered price movement compare to smaller box size. The default value is "0.25%"
Reversal Size : Minimum boxes required for column reversal. The default value is "3".
Stoploss Size In Box : To get affordable trade give the number of boxes for stop loss.
開源腳本
本著TradingView的真正精神,此腳本的創建者將其開源,以便交易者可以查看和驗證其功能。向作者致敬!雖然您可以免費使用它,但請記住,重新發佈程式碼必須遵守我們的網站規則。
免責聲明
這些資訊和出版物並不意味著也不構成TradingView提供或認可的金融、投資、交易或其他類型的意見或建議。請在使用條款閱讀更多資訊。
開源腳本
本著TradingView的真正精神,此腳本的創建者將其開源,以便交易者可以查看和驗證其功能。向作者致敬!雖然您可以免費使用它,但請記住,重新發佈程式碼必須遵守我們的網站規則。
免責聲明
這些資訊和出版物並不意味著也不構成TradingView提供或認可的金融、投資、交易或其他類型的意見或建議。請在使用條款閱讀更多資訊。