INVITE-ONLY SCRIPT
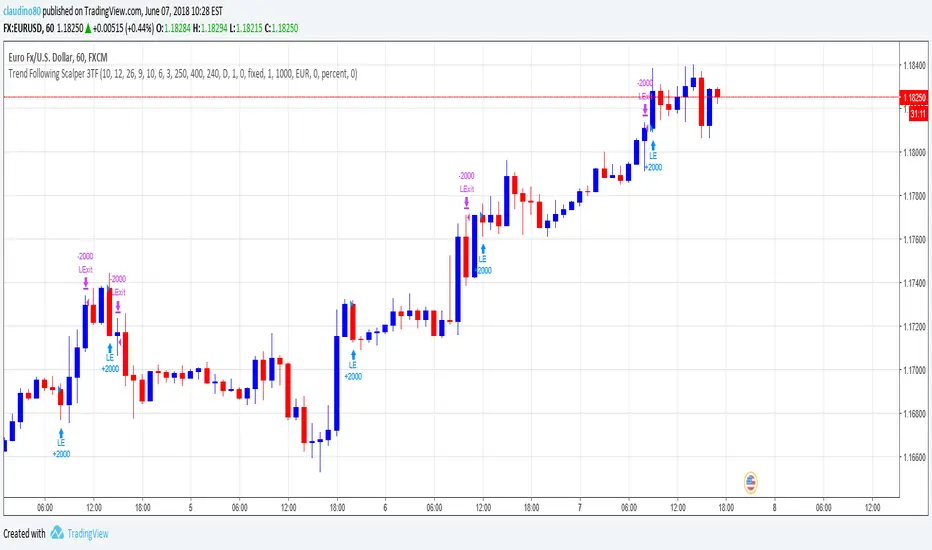
Trend Following Scalper 3 Time Framse
Do you think it is a good idea to use the Stochastic / MACD / EMA and cross check THREE timeframes to detect a new trend?
If you think that it would be a good idea, this is the script that you are looking for.
The Trend Following Scalper (3 Time Frames) script has been developed to automate the trading activity by detecting a new trend and by scalping a fixed amount of pips each trade. That is why it is called Trend Following Scalper.
How does the script detect the new trend?
The beginning of the new trend is detected on the lower timeframe (1H is the suggested one) by joining the information of the Stochastic, MACD and Exponential Moving Average.
Once a potential trade has been detected on lower timeframe, the script confirms it by looking the upper timeframe (e.g. Daily + H4) by gathering the same indicator / parameter information.
If the threes timeframes are moving in the same direction, the script open a new trade.
Why do we need to merge lower and higher timeframe before open the trade?
The lower timeframe shows a shorter Price Action context. The short price action context has a short life! By looking at the higher time frames context the script tries to exclude the short life counter-trend moves. At the end, a new trade is open only if the higher timeframe context supports the lower timeframe indication.
What about the Risk-Reward (following RR) ratio?
The RR is set by default as 1.6 (stop loss 25 pips and take profit 40 pips).
This configuration has been heavily tested on multiple crosses and it has shown a good Equity Line with a low Drawdown.
(Note: the stop loss and take profit can be changed by the user via the parameter pages. Suggest RR > 1.5)
What about the accuracy of the Script?
The average script accuracy is > 55% on the H1 time frame (tested with various crosses).
With this accuracy, and by risking 0.6% of the capital each trade, your capital will grow > 25% every 100 trades.
What about the drawdown?
It depends on the capital and the size of the position used on each trade.
For example, with an initial capital of 1000 Euros and by risking 0.6% of the capital each trade, the drawdown is close to 3%.
(The strategy tester result has been calculated starting from January 2017. The strategy produced 527E (i.e. 52% gain) starting from a 1000E capital and risking 0.5% each trade)
Do you want to try the script? Please write me!
Do you have some question? Please write me!
僅限邀請腳本
只有經作者批准的使用者才能訪問此腳本。您需要申請並獲得使用權限。該權限通常在付款後授予。如欲了解更多詳情,請依照以下作者的說明操作,或直接聯絡claudino80。
除非您完全信任其作者並了解腳本的工作原理,否則TradingView不建議您付費或使用腳本。您也可以在我們的社群腳本中找到免費的開源替代方案。
作者的說明
提醒:在請求訪問權限之前,請閱讀僅限邀請腳本指南。
免責聲明
這些資訊和出版物並不意味著也不構成TradingView提供或認可的金融、投資、交易或其他類型的意見或建議。請在使用條款閱讀更多資訊。
僅限邀請腳本
只有經作者批准的使用者才能訪問此腳本。您需要申請並獲得使用權限。該權限通常在付款後授予。如欲了解更多詳情,請依照以下作者的說明操作,或直接聯絡claudino80。
除非您完全信任其作者並了解腳本的工作原理,否則TradingView不建議您付費或使用腳本。您也可以在我們的社群腳本中找到免費的開源替代方案。
作者的說明
提醒:在請求訪問權限之前,請閱讀僅限邀請腳本指南。
免責聲明
這些資訊和出版物並不意味著也不構成TradingView提供或認可的金融、投資、交易或其他類型的意見或建議。請在使用條款閱讀更多資訊。