PROTECTED SOURCE SCRIPT
已更新 zibi fib2

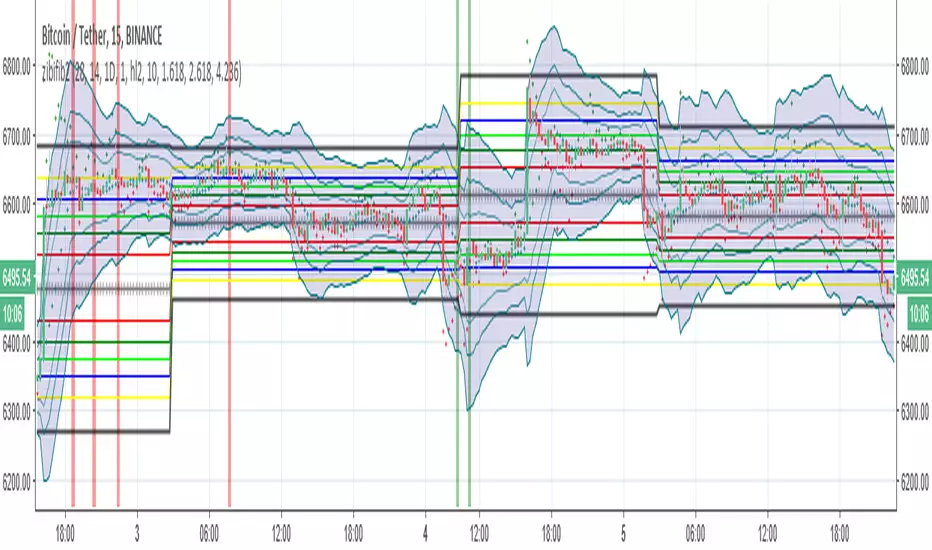
so how this system work:
1. zibi is a volume indicator that similar to obv but it calculate volume per candle differently (my idea)
2.fib
3.bolliger fib
zibi is overshooting indicator since it a volume indicator per candle its signal is before the price candles and its allow us to cross the fib in a smart way
when ever zibi is bellow lowest fib it also in lowest volume possible so buy will be only if it volume start to increase and then we expect the price to move up
since we buy in lowest fib then the cycle will go from down to up as the sell will be exact the opposite.
next we add Bollinger fib to constrain the overshooting of zibi so optimal point only are selected
inside there are alerts ready
for testing check the strategy version of this indicator that combine volume and fib
have fun
發行說明
change the calculation of volume it was set on OBV instead of zibi發行說明
add another exit point for safety發行說明
add another buy pointone need to understand that the lower the time frame its buy less and more accurate so time frame of 15 min or 5 min are seems to be the best
發行說明
add pivot system to clean up bad signals發行說明
there was issue with repainting I hope this fix it 受保護腳本
此腳本以閉源形式發佈。 不過,您可以自由使用,沒有任何限制 — 點擊此處了解更多。
免責聲明
這些資訊和出版物並非旨在提供,也不構成TradingView提供或認可的任何形式的財務、投資、交易或其他類型的建議或推薦。請閱讀使用條款以了解更多資訊。
受保護腳本
此腳本以閉源形式發佈。 不過,您可以自由使用,沒有任何限制 — 點擊此處了解更多。
免責聲明
這些資訊和出版物並非旨在提供,也不構成TradingView提供或認可的任何形式的財務、投資、交易或其他類型的建議或推薦。請閱讀使用條款以了解更多資訊。