INVITE-ONLY SCRIPT
已更新 HuD DE | TE
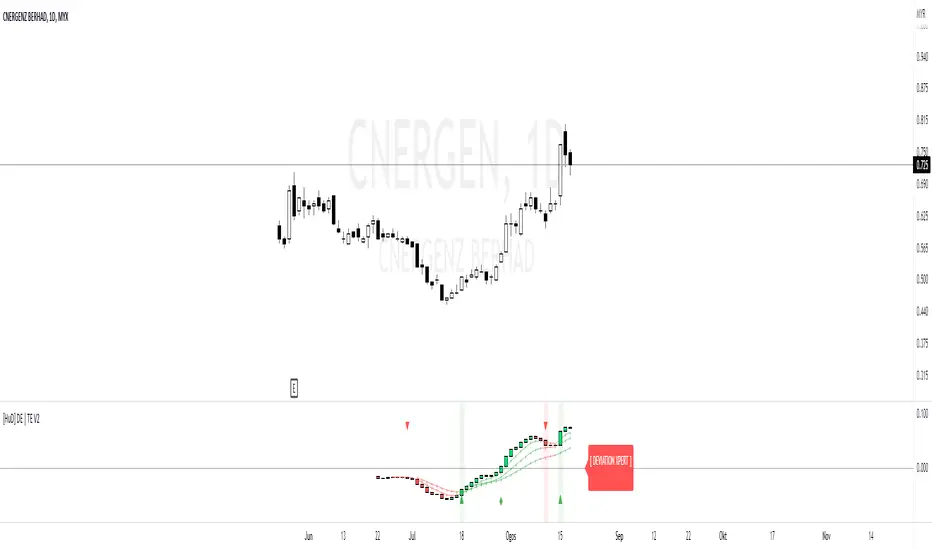
HuD DE | TE Expert is a combination of two indicators.
1. DE or Deviation Expert
DE is based on ema5 and ema20. This MA algorithm is to filter signals such as trend and convergence/divergence. It is represented by HA Candles.
There are 4 signals to assist traders in making decisions
i. Golden Cross = possible entry point ( Green Triangle )
ii. Death Cross = possible exit point ( Red Triangle )
iii. Cross Up Level 0 = look for Buy opportunity ( Green Diamond )
iv. Cross Down Level 0 = look for Sell opportunity ( Red Diamond )
There are also ema lines to monitor the movement of current candle movement.
2. TE or Trend Expert
TE is based on ema5 movement to assist traders to see the overall trend of chart movement.
The movement is represented by HA Candles.
There are 4 ema's lines to monitor HA Candles movements.
This lines act as support / resistance which can assist traders to see the current trend of the chart.
For example, if line is green ( Uptend) and the next candle drop below the first green ema lines, next line (ema10) acts as support.
If next candle breaks ema10, we can consider making an exit plan. Or for swing traders, they can consider waiting until candle drop below ema50 ( purple line ) before deciding to exit.
https://www.tradingview.com/x/hZ8RxXBf/
Note: This indicator setting only suitable for Bursa Malaysia market.
發行說明
Add in Alert Function :🟢 Golden Cross Alert
🔴 Death Cross Alert
✅ Cross Level 0 Alert
Telegram : @HudHudAlert
Telegram Channel : t.me/HudHudAlert
TV Indicator : my.tradingview.com/u/Hud_Hud/
Telegram Channel : t.me/HudHudAlert
TV Indicator : my.tradingview.com/u/Hud_Hud/
免責聲明
這些資訊和出版物並不意味著也不構成TradingView提供或認可的金融、投資、交易或其他類型的意見或建議。請在使用條款閱讀更多資訊。
Telegram : @HudHudAlert
Telegram Channel : t.me/HudHudAlert
TV Indicator : my.tradingview.com/u/Hud_Hud/
Telegram Channel : t.me/HudHudAlert
TV Indicator : my.tradingview.com/u/Hud_Hud/
免責聲明
這些資訊和出版物並不意味著也不構成TradingView提供或認可的金融、投資、交易或其他類型的意見或建議。請在使用條款閱讀更多資訊。