OPEN-SOURCE SCRIPT
Percent Change Indicator
Percent Change Indicator Description
Overview:
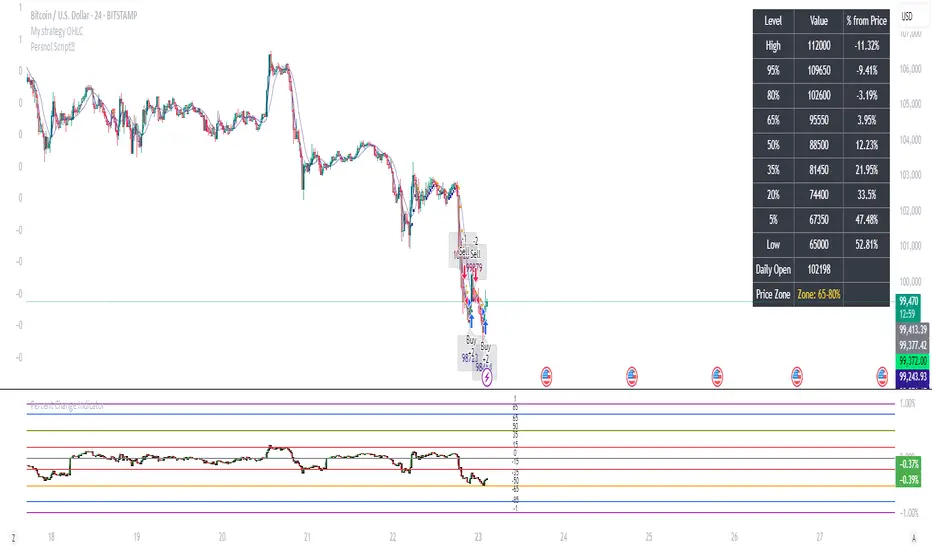
The Percent Change Indicator is a Pine Script (version 6) indicator designed for TradingView to calculate and visualize the percentage change of the current close price relative to a user-selected reference price. It provides a customizable interface to display percentage changes as candlesticks or a line plot, with optional horizontal lines and labels for key levels. The indicator also includes visual signals and alerts for user-defined percentage thresholds, making it useful for identifying significant price movements.
Key Features:
1. Percentage Change Calculation:
- Computes the percentage change of the current close price compared to a reference price, scaled by a user-defined length parameter.
- Formula: percentChange = (close - refPrice) / refPrice * len
- The reference price is sourced from a user-selected timeframe (default: 1D) and price type (Open, High, Low, Close, HL2, HLC3, or HLCC4).
2. Visualization Options:
- Candlestick Plot: Displays percentage change as candlesticks, colored green for rising values and red for falling values.
- Line Plot: Plots the percentage change as a line, with the same color logic.
- Horizontal Lines: Optional horizontal lines at key percentage levels (0%, ±0.2%, ±0.5%, ±0.8%, ±1%) for reference.
- Labels: Optional labels for percentage levels (0, ±15%, ±35%, ±50%, ±65%, ±85%, ±100%) displayed at the chart's right edge.
- All visualizations are toggleable via input settings.
3. Signal and Alert System:
- Threshold-Based Signals: Plots green triangles below bars for long signals (percent change above a user-defined threshold) and red triangles above bars for short signals (percent change below the threshold).
- Alerts: Configurable alerts for long and short conditions, triggered when the percentage change crosses the user-defined threshold (default: 2%). Alert messages include the threshold value for clarity.
4. Customizable Inputs:
- Show Labels: Toggle visibility of percentage level labels (default: true).
- Show Percentage Change: Toggle the line plot of percentage change (default: true).
- Show HLines: Toggle visibility of horizontal reference lines (default: false).
- Show Candle Plot: Toggle the candlestick plot (default: true).
- Percent Change Length: Adjust the scaling factor for percentage change (default: 14).
- Plot Timeframe: Select the timeframe for the reference price (default: 1D).
- Price Type: Choose the reference price type (Open, High, Low, Close, HL2, HLC3, HLCC4; default: Open).
- Percentage Threshold: Set the threshold for long/short signals and alerts (default: 0.02 or 2%).
How It Works:
- The indicator fetches the reference price using request.security() based on the selected timeframe and price type.
- It calculates the percentage change and scales it by the user-defined length.
- Visuals (candlesticks, lines, labels, horizontal lines) are plotted based on user preferences.
- Long and short signals are generated when the percentage change exceeds or falls below the user-defined threshold, with corresponding triangles plotted and alerts triggered.
Use Cases:
- Trend Identification: Monitor significant price movements relative to a reference price.
- Signal Generation: Identify potential entry/exit points based on percentage change thresholds.
- Custom Analysis: Analyze price changes across different timeframes and price types for various trading strategies.
- Alert Notifications: Receive alerts for significant price movements to stay informed without constant chart monitoring.
Setup Instructions:
1. Add the indicator to a TradingView chart.
2. Adjust input settings (timeframe, price type, threshold, etc.) to suit your analysis.
3. Enable/disable visualization options (candlesticks, lines, labels, horizontal lines) as needed.
4. Set up alerts in TradingView:
- Go to the "Alerts" tab and select "Percent Change Indicator."
- Choose "Long Alert" or "Short Alert" to monitor threshold crossings.
- Configure alert frequency and notification method (e.g., email, webhook).
Notes:
- The indicator is non-overlay, displayed in a separate pane below the main chart.
- Alerts trigger on bar close by default; adjust TradingView alert settings for real-time notifications if needed.
- The indicator is released under the Mozilla Public License 2.0.
Author: Dshergill
This indicator is ideal for traders seeking a flexible tool to track percentage-based price movements with customizable visuals and alerts.
Overview:
The Percent Change Indicator is a Pine Script (version 6) indicator designed for TradingView to calculate and visualize the percentage change of the current close price relative to a user-selected reference price. It provides a customizable interface to display percentage changes as candlesticks or a line plot, with optional horizontal lines and labels for key levels. The indicator also includes visual signals and alerts for user-defined percentage thresholds, making it useful for identifying significant price movements.
Key Features:
1. Percentage Change Calculation:
- Computes the percentage change of the current close price compared to a reference price, scaled by a user-defined length parameter.
- Formula: percentChange = (close - refPrice) / refPrice * len
- The reference price is sourced from a user-selected timeframe (default: 1D) and price type (Open, High, Low, Close, HL2, HLC3, or HLCC4).
2. Visualization Options:
- Candlestick Plot: Displays percentage change as candlesticks, colored green for rising values and red for falling values.
- Line Plot: Plots the percentage change as a line, with the same color logic.
- Horizontal Lines: Optional horizontal lines at key percentage levels (0%, ±0.2%, ±0.5%, ±0.8%, ±1%) for reference.
- Labels: Optional labels for percentage levels (0, ±15%, ±35%, ±50%, ±65%, ±85%, ±100%) displayed at the chart's right edge.
- All visualizations are toggleable via input settings.
3. Signal and Alert System:
- Threshold-Based Signals: Plots green triangles below bars for long signals (percent change above a user-defined threshold) and red triangles above bars for short signals (percent change below the threshold).
- Alerts: Configurable alerts for long and short conditions, triggered when the percentage change crosses the user-defined threshold (default: 2%). Alert messages include the threshold value for clarity.
4. Customizable Inputs:
- Show Labels: Toggle visibility of percentage level labels (default: true).
- Show Percentage Change: Toggle the line plot of percentage change (default: true).
- Show HLines: Toggle visibility of horizontal reference lines (default: false).
- Show Candle Plot: Toggle the candlestick plot (default: true).
- Percent Change Length: Adjust the scaling factor for percentage change (default: 14).
- Plot Timeframe: Select the timeframe for the reference price (default: 1D).
- Price Type: Choose the reference price type (Open, High, Low, Close, HL2, HLC3, HLCC4; default: Open).
- Percentage Threshold: Set the threshold for long/short signals and alerts (default: 0.02 or 2%).
How It Works:
- The indicator fetches the reference price using request.security() based on the selected timeframe and price type.
- It calculates the percentage change and scales it by the user-defined length.
- Visuals (candlesticks, lines, labels, horizontal lines) are plotted based on user preferences.
- Long and short signals are generated when the percentage change exceeds or falls below the user-defined threshold, with corresponding triangles plotted and alerts triggered.
Use Cases:
- Trend Identification: Monitor significant price movements relative to a reference price.
- Signal Generation: Identify potential entry/exit points based on percentage change thresholds.
- Custom Analysis: Analyze price changes across different timeframes and price types for various trading strategies.
- Alert Notifications: Receive alerts for significant price movements to stay informed without constant chart monitoring.
Setup Instructions:
1. Add the indicator to a TradingView chart.
2. Adjust input settings (timeframe, price type, threshold, etc.) to suit your analysis.
3. Enable/disable visualization options (candlesticks, lines, labels, horizontal lines) as needed.
4. Set up alerts in TradingView:
- Go to the "Alerts" tab and select "Percent Change Indicator."
- Choose "Long Alert" or "Short Alert" to monitor threshold crossings.
- Configure alert frequency and notification method (e.g., email, webhook).
Notes:
- The indicator is non-overlay, displayed in a separate pane below the main chart.
- Alerts trigger on bar close by default; adjust TradingView alert settings for real-time notifications if needed.
- The indicator is released under the Mozilla Public License 2.0.
Author: Dshergill
This indicator is ideal for traders seeking a flexible tool to track percentage-based price movements with customizable visuals and alerts.
開源腳本
秉持TradingView一貫精神,這個腳本的創作者將其設為開源,以便交易者檢視並驗證其功能。向作者致敬!您可以免費使用此腳本,但請注意,重新發佈代碼需遵守我們的社群規範。
免責聲明
這些資訊和出版物並非旨在提供,也不構成TradingView提供或認可的任何形式的財務、投資、交易或其他類型的建議或推薦。請閱讀使用條款以了解更多資訊。
免責聲明
這些資訊和出版物並非旨在提供,也不構成TradingView提供或認可的任何形式的財務、投資、交易或其他類型的建議或推薦。請閱讀使用條款以了解更多資訊。