OPEN-SOURCE SCRIPT
已更新 ATR Trend Reversal Zone indicator
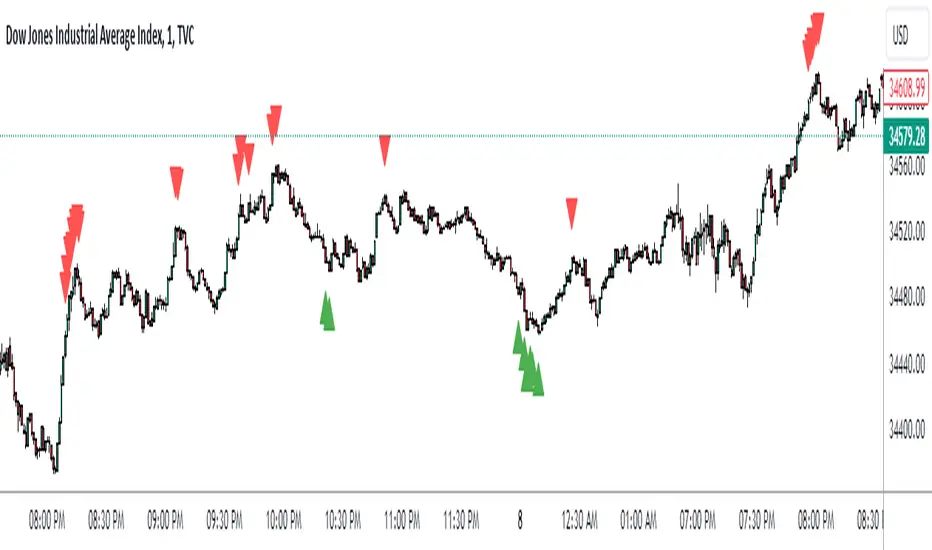
This indicator helps avoid taking reversal trades too close to the 21 EMA, which may fail since the market often continues its trend after retracing from the 21 EMA level. It does not generate a direct signal for reversal trades but rather indicates points where you can consider potential reversal trades based on your trading methodology
This script defines an indicator that calculates the 21 Exponential Moving Average (EMA) and the Average True Range (ATR) for a given period. It then computes the distance between the most recent closing price and the 21 EMA in terms of ATR units. If this distance is equal to or greater than 3 ATRs, a small green circle is plotted below the corresponding bar on the chart, indicating a potential reversal condition.
This script defines an indicator that calculates the 21 Exponential Moving Average (EMA) and the Average True Range (ATR) for a given period. It then computes the distance between the most recent closing price and the 21 EMA in terms of ATR units. If this distance is equal to or greater than 3 ATRs, a small green circle is plotted below the corresponding bar on the chart, indicating a potential reversal condition.
發行說明
Update:This script will plot a red circle above the candle when the distance is greater than or equal to 3 and the close is above the 21 EMA. It will also plot a green circle below the candle when the distance is less than or equal to 3 and the close is below the 21 EMA.
It is strongly recommended to adjust the ATR values and thoroughly back test this indicator for the specific instrument and time frame you intend to trade.
發行說明
Update:Will update the script with ATR bands to increase performance.
發行說明
-開源腳本
本著TradingView的真正精神,此腳本的創建者將其開源,以便交易者可以查看和驗證其功能。向作者致敬!雖然您可以免費使用它,但請記住,重新發佈程式碼必須遵守我們的網站規則。
免責聲明
這些資訊和出版物並不意味著也不構成TradingView提供或認可的金融、投資、交易或其他類型的意見或建議。請在使用條款閱讀更多資訊。
開源腳本
本著TradingView的真正精神,此腳本的創建者將其開源,以便交易者可以查看和驗證其功能。向作者致敬!雖然您可以免費使用它,但請記住,重新發佈程式碼必須遵守我們的網站規則。
免責聲明
這些資訊和出版物並不意味著也不構成TradingView提供或認可的金融、投資、交易或其他類型的意見或建議。請在使用條款閱讀更多資訊。