PROTECTED SOURCE SCRIPT
已更新 Cointegration Matrix (Indices)
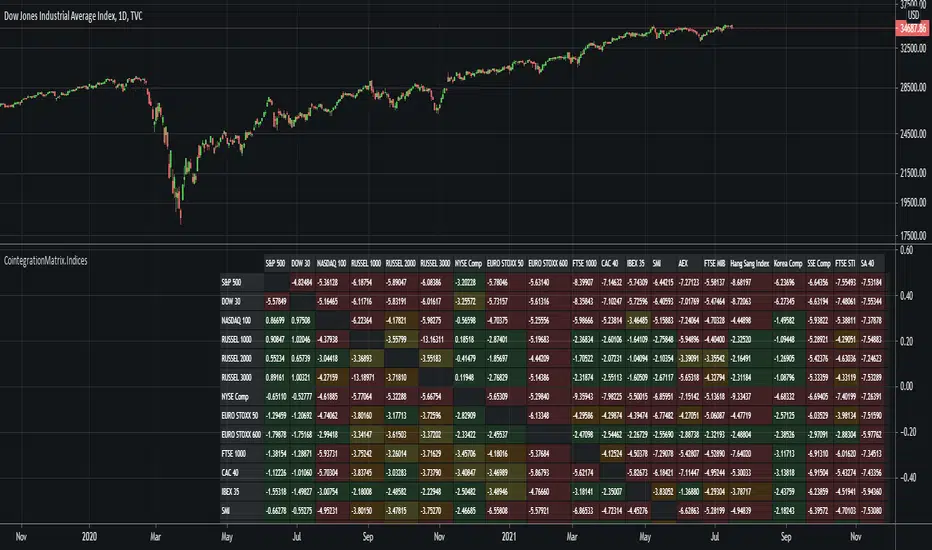
This indicator plots a cointegration matrix for pairings of most major stock indices. The matrix is populated with ADF t-stats (from an ADF-test with 1 lag). An ADF-test (Augmented Dickey-Fuller test) tests the null hypothesis that an AR process has a unit root. If rejected, the alternative hypothesis is usually that the AR process is either stationary or trend-stationary.
Technically what we're doing is running an ADF-test on the residuals (spread) of each pairing (i.e. a cointegration test). So we're testing if there is a unit root in the spread between the two assets of a pairing. A unit root being present in the spread essentially means the spread varies randomly over time, and any mean reversion in the spread is very hard to predict, or may never happen. If there is no evidence of a unit root, the spread (distance between the assets) should remain more or less constant over time, or rise/fall in close to the same rate over time (if it can be modelled as an AR process). The more negative the number, the stronger the rejection of the idea that the spread has a unit root. So in statistics we choose a critical value that corresponds to a confidence level of the test. In this case, -3.238 equals a confidence level of 90%, -3.589 equals a confidence level of 95% and -4.375 equals a confidence level of 99%. So the colors are based on the confidence level of the test statistic (the t-stat, i.e. the number of the pairing in the matrix). So if the number is greater than -3.238 it is green, if it's between -3.238 and -3.589 it's yellow, if it's between -3.589 and -4.375 it's orange, and if its lower than -4.375 it's red.
There are multiple ways to interpret the results. A strong rejection of the presence of a unit root (i.e. a value of -4.375 or below) is not a guarantee that there is no unit root, or that any of the two alternative hypotheses (that the spread is stationary or trend-stationary) are correct. It only means that in 99% of the cases, if the spread is an AR process, the test is right, and there is no unit root in the spread. Therefore, the results of this test is no guarantee that the result proves one of the alternative solutions. Green therefore means that a unit root cannot be ruled out (which can be interpreted as "the two indices probably don't move together over time"), and red means that a unit root is likely not present (which can be interpreted as "the two indices may move together over time").
NOTE: The indicator can take a while to load since it is loading data from 20 stock indices and calculating the ADF t-stat for 380 pairings.
發行說明
Some tickers were removed from TVC, causing the indicator to stop loading. This has now been fixed by removing those tickers from the matrix.受保護腳本
此腳本以閉源形式發佈。 不過,您可以自由且不受任何限制地使用它 — 在此處了解更多資訊。
免責聲明
這些資訊和出版物並不意味著也不構成TradingView提供或認可的金融、投資、交易或其他類型的意見或建議。請在使用條款閱讀更多資訊。
免責聲明
這些資訊和出版物並不意味著也不構成TradingView提供或認可的金融、投資、交易或其他類型的意見或建議。請在使用條款閱讀更多資訊。