OPEN-SOURCE SCRIPT
已更新 EngineerBuySellHighRisk
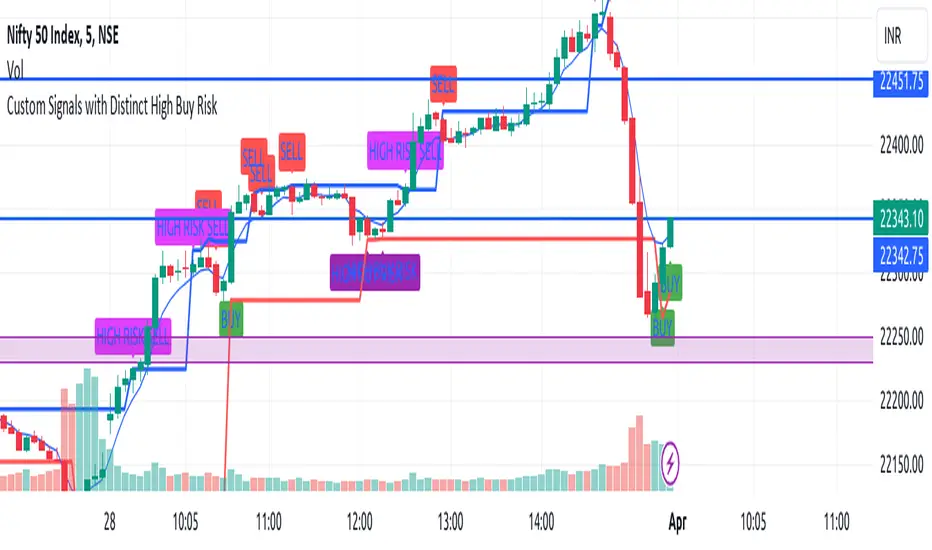
This TradingView indicator script is designed to identify various trading signals based on price action and the 5-period Exponential Moving Average (EMA), providing traders with insights into potential buy and sell opportunities. The script generates signals under the following categories:
Buy Signals
Regular Buy Signal: Identified when the entire previous candle (Candle 1) is below the 5 EMA, and the following candle (Candle 2) has a higher high compared to Candle 1 and closes higher than its opening price (indicating a green candle). This signal suggests a potential upward momentum as the price moves above the recent lows and the 5 EMA, indicating a buying opportunity.
High-Risk Buy Signal: Similar to the regular buy signal, but it specifically targets scenarios where Candle 1's high is exactly on the 5 EMA. Candle 2 must either have a higher high than Candle 1 or touch the 5 EMA, and it must close higher than its opening price. This signal indicates a potential for an upward trend continuation but is considered higher risk due to the price's proximity to the 5 EMA.
High Buy Risk Signal: This signal is generated under the same conditions as the regular buy signal regarding the position of Candle 1 relative to the 5 EMA and the requirement for Candle 2 to have a higher high. However, it allows for Candle 2 to close lower than its opening price (indicating a red candle), broadening the criteria for a buy signal. This modification acknowledges the potential for buying opportunities even in cases where Candle 2 closes down, assuming the price still shows upward momentum compared to Candle 1.
Sell Signals
Sell Signal: Generated when Candle 1 is entirely above the 5 EMA, and the following candle (Candle 2) has a lower low compared to Candle 1 and closes lower than its opening price (indicating a red candle). This setup suggests a potential downward trend, signaling a selling or shorting opportunity.
High Risk Sell Signal: This signal is for scenarios where Candle 1 is above the 5 EMA, and Candle 2's low is lower than Candle 1's low, but unlike the standard sell signal, it allows Candle 2 to close higher than its opening price (indicating a green candle). It signifies a potential downward price movement but with increased risk due to the mixed signal from Candle 2's close.
Stop-Loss Levels
Buy Stop-Loss Level: For buy signals, the stop-loss is set at the low of Candle 1, providing a risk management level to minimize potential losses if the market moves against the trade.
Sell Stop-Loss Level: For sell signals, the stop-loss is set at the high of Candle 1, serving as a risk management tool to protect against unfavorable price movements after entering a short position.
Visualization
The script uses different colors and labels to distinguish between the types of signals, making it easier for traders to identify and act upon these trading opportunities. It plots the 5 EMA for reference, providing context for the price action relative to this moving average. This script aims to offer a comprehensive toolkit for traders looking for nuanced entry and exit points based on short-term price movements and momentum relative to the 5 EMA.
發行說明
added previous price support 發行說明
changed title.開源腳本
本著TradingView的真正精神,此腳本的創建者將其開源,以便交易者可以查看和驗證其功能。向作者致敬!雖然您可以免費使用它,但請記住,重新發佈程式碼必須遵守我們的網站規則。
免責聲明
這些資訊和出版物並不意味著也不構成TradingView提供或認可的金融、投資、交易或其他類型的意見或建議。請在使用條款閱讀更多資訊。
開源腳本
本著TradingView的真正精神,此腳本的創建者將其開源,以便交易者可以查看和驗證其功能。向作者致敬!雖然您可以免費使用它,但請記住,重新發佈程式碼必須遵守我們的網站規則。
免責聲明
這些資訊和出版物並不意味著也不構成TradingView提供或認可的金融、投資、交易或其他類型的意見或建議。請在使用條款閱讀更多資訊。