PROTECTED SOURCE SCRIPT
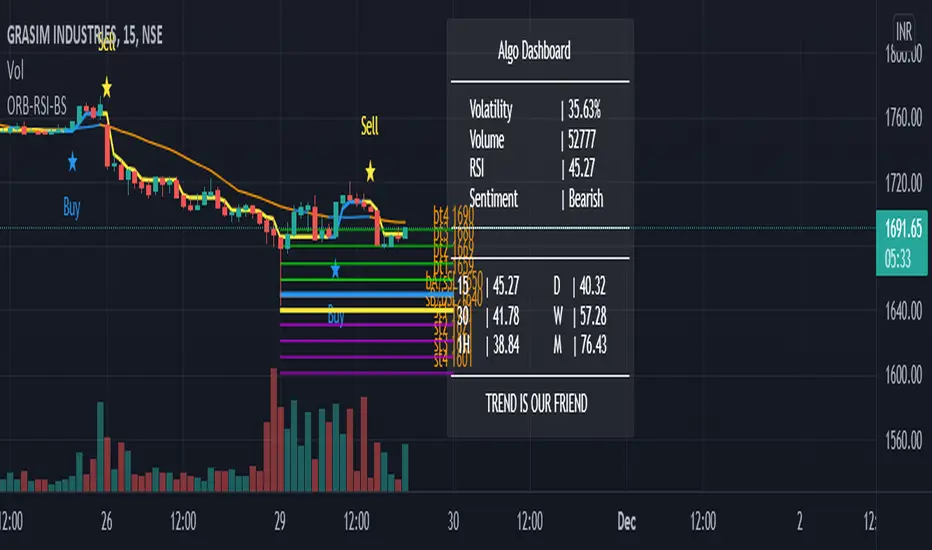
已更新 GANN-ORB-RSI-BS

Gann relied heavily on geometrical and numerical relationships
and created several tools to help with his work. Among these
tools are the Square of Nine, Square of 144, and the Hexagon.
The Square of Nine, or Square as we will refer to here, can be
constructed in at least two ways. The static Square has the
number 1 at the center and the dynamic Square has the historic
low of the time series in the center.
發行說明
How to use Gann?Gann levels are given as targets on buy and sell sides.
Buy condition - when green candle closes above bA, blue line and exit at bt1/bt2/bt3. Stoploss is the yellow line value.
Similarly for Sell condition, when red candle closes below sB, yellow line and exit at st1/st2/st3. Stoploss is the blue line value.
受保護腳本
此腳本以閉源形式發佈。 However, you can use it freely and without any limitations – learn more here.
免責聲明
The information and publications are not meant to be, and do not constitute, financial, investment, trading, or other types of advice or recommendations supplied or endorsed by TradingView. Read more in the Terms of Use.