PROTECTED SOURCE SCRIPT
已更新 New Improved Support Resistance / Pivot Points (NO REPAINT)
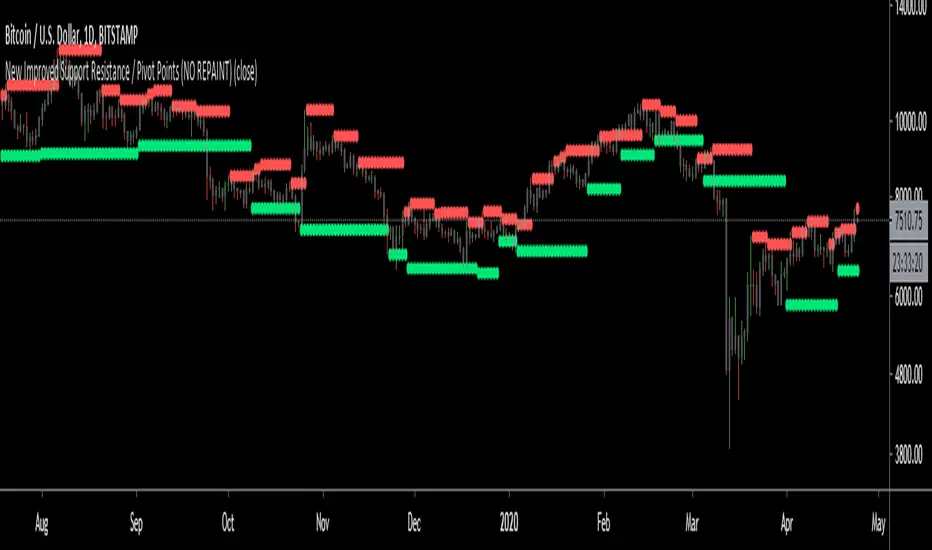
This indicator plots local pivot points / support resistance levels in real time (No Repaint). I created this indicator based on my own research and testing (i.e. it is not just a a Pinescript adaptation of some other indicator available online).
The Problem with Similar Indicators Which Are Currently Available On TradingView:
My Solution:
P.S.: Future developments will be using these levels to create an automatic plot of fibonacci retracement levels.
The Problem with Similar Indicators Which Are Currently Available On TradingView:
- Inaccurate placement of swing/pivot/SR points (making your screen cluttered with meaningless levels).
- Repainting (meaning the historical values change as new data becomes available; this is misleading and not very useful when trading in real time).
- Have a long delay before confirming/plotting the new pivot points (20/20 hindsight...).
- Require you to specify a lookback period and simply looks for the highest or lowest value over that time frame (which isn't very useful since it disregards all of the swings in between).
- Do not show all of the historical swing levels, only the most recent ones.
My Solution:
- Accurately places swing/pivot/SR points on local highs and lows once a short term trend is over (allowing you to easily identify reversal points).
- Does not repaint (the historic values shown are exactly what would have been seen upon the close of the given candles in live trading; this means you can use this indicator for live trading).
- Has minimal lag. New swing lows/highs are typically identified by this indicator on the candle which immediately following the swing point (this allows for better entries/exits rather than waiting for the price to run too far in the wrong direction before confirmation).
- No lookback period required. The indicator will automatically identify new swings regardless how long the run lasts.
- Allows you to adjust for more/less sensitivity.
P.S.: Future developments will be using these levels to create an automatic plot of fibonacci retracement levels.
發行說明
Added extra logic to prevent repainting during "replay mode" 發行說明
candle colors for short term trend direction發行說明
Updated for increased precision發行說明
Removed accidental drawings on last update受保護腳本
此腳本以閉源形式發佈。 不過,您可以自由使用,沒有任何限制 — 點擊此處了解更多。
免責聲明
這些資訊和出版物並非旨在提供,也不構成TradingView提供或認可的任何形式的財務、投資、交易或其他類型的建議或推薦。請閱讀使用條款以了解更多資訊。
免責聲明
這些資訊和出版物並非旨在提供,也不構成TradingView提供或認可的任何形式的財務、投資、交易或其他類型的建議或推薦。請閱讀使用條款以了解更多資訊。