PROTECTED SOURCE SCRIPT
已更新 3commas BNB/USD 1H Strategy

*** DISCLAIMER ***
This script is speculative - it uses a highly aggressive model and may not make you money. It has worked well for me so far but you need to do your own DD and make your own decisions. I accept no liability for anything that happens as a result of using this script. Use this at your own caution.
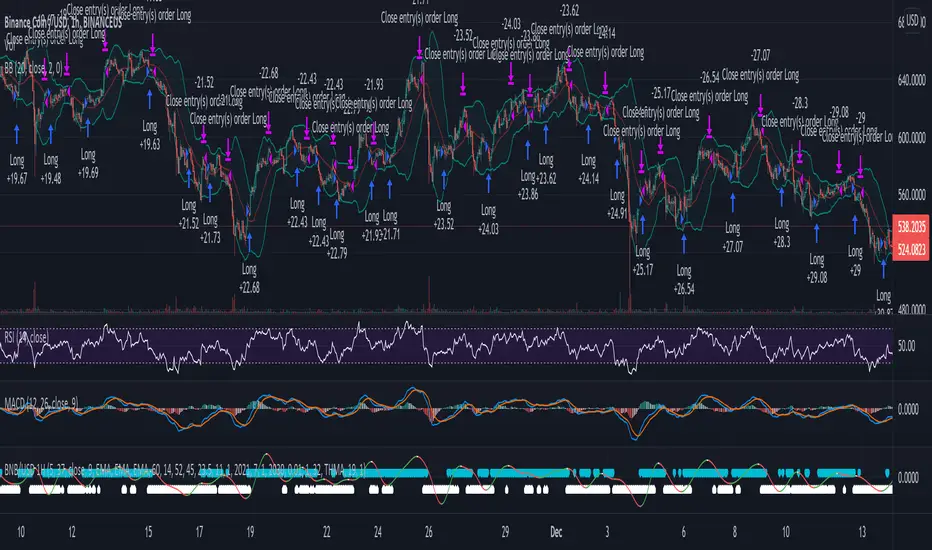
My first published work! I took a few concepts I found in other scripts, tweaked them to match what I had in mind, added some ideas of my own and then added 3commas hooks. Essentially this script is a variable MACD indicator with linear regression and a lot of curve smoothing. It will buy and sell like any other MACD indicator, though it won't exactly match the MACD line you will see on regular MACD indicators due to the smoothing and linear regression. The stop loss should prevent the biggest losses though you will still lose some rounds as this is very aggressive. The parameters I have set up here work best for BNB however feel free to experiment with other coins. The linear regression is set high by default which is what I've found works best for BNB/USD.
Charts should be set to BNB/USD 1HR. I used Binance.us as I was building this but you should have success using other exchanges that offer BNB as well.
This script is set up to use with a 3commas DCA bot though you need access to the entire script in order for that to happen. You can add it and manually place orders or use alarms to test. If you want full access so you can set your 3commas alerts, message me and we can figure something out!
發行說明
I consolidated the stop loss and regular take profit into one buy to make it easier to set this up. I also added a backtester. I plan to also add RSI-based entry and exit conditions later today.發行說明
I adjusted this a bit more today. I added an RSI Threshold feature that I moved over and modified from one of my other bots I just made. It really unlocks what you can do with this bot.Under RSI Settings you can pick to use RSI Thresholds as a condition for buys and/or sells. You check the appropriate box(es) and then you set the thresholds that are required. The bot won't make a buy unless a bar's RSI value is equal to or lower than your buy threshold. Similarly, it won't make a sell unless a bar's RSI is above the sell threshold. You can also adjust the time frame that the RSI uses although I would suggest not using a lower value than your chart's time frame as it will only update once per bar, so if you use a 5m RSI and a one hour chart it'll only use the 5m RSI at the close of each bar (so once per hour.) I put this in to give users a little more control over how buys and sell are executed.
You can also decide whether or not to view all points that your RSI thresholds are met on the chart. Keep in mind that this will display ALL points, not just those on which buys or sells happen. I could have done it that way but you will already see the trades on the chart and this just gives more info. The white and red markers represent POTENTIAL buy and sell points (ie any bar on the chart that meets the requirements gets a marker, not just bars where buys or sells actually take place.) If your thresholds are 30/70 it's manageable, however if you increase the buy threshold value or reduce the sell threshold value be prepared to see quite a few markers. The messiness of this is why I decided to make disabling viewing them an option.
受保護腳本
此腳本以閉源形式發佈。 不過,您可以自由且不受任何限制地使用它 — 在此處了解更多資訊。
免責聲明
這些資訊和出版物並不意味著也不構成TradingView提供或認可的金融、投資、交易或其他類型的意見或建議。請在使用條款閱讀更多資訊。
受保護腳本
此腳本以閉源形式發佈。 不過,您可以自由且不受任何限制地使用它 — 在此處了解更多資訊。
免責聲明
這些資訊和出版物並不意味著也不構成TradingView提供或認可的金融、投資、交易或其他類型的意見或建議。請在使用條款閱讀更多資訊。