OPEN-SOURCE SCRIPT
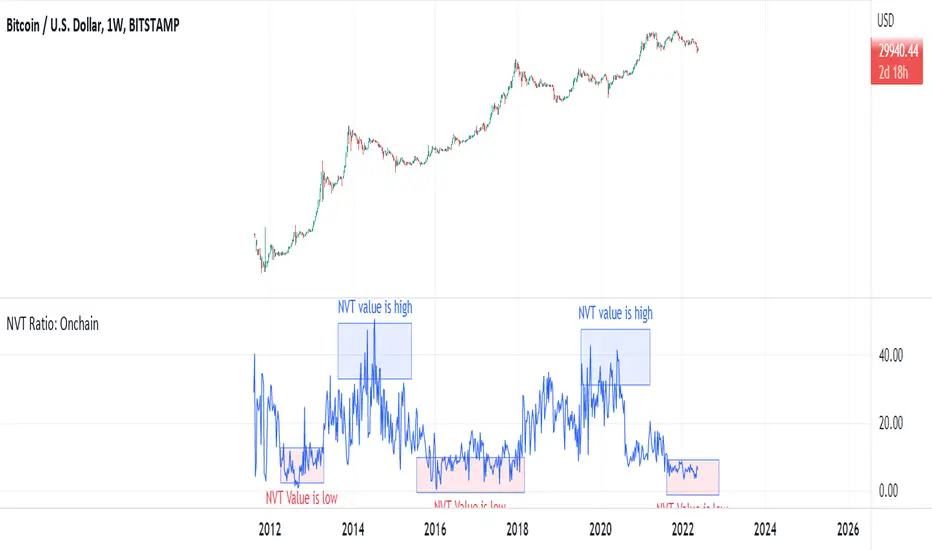
NVT Ratio: Onchain

NVT Ratio
Defined as the ratio of market capitalization divided by transacted volume (in USD).
Network Value to Transactions Ratio (NVT Ratio) is defined as the ratio of market capitalization divided by transacted volume in the specified window.
History
NVT first made an appearance as a tweet on Woo Bull account in Feb 2017. In that tweet he promised an explanatory article which came much later in Oct 2017, first debuting on Forbes.
In Feb 2018, Dimitry Kalichkin published his work to improve NVT for use as a more responsive indicator, hence Kalichkin NVT Signal. In the same month, Woo Bull applied some trader techniques to NVT Signal and published an article summarising how to use it within a trading environment.
Interpretation:
NVT Ratio (Network Value to Transactions Ratio) is similar to the PE Ratio used in equity markets.
this indicator measures whether the blockchain network is overvalued or not.
When Bitcoin`s NVT is high, it indicates that its network valuation is outstripping the value being transmitted on its payment network, this can happen when the network is in high growth and investors are valuing it as a high return investment, or alternatively when the price is in an unsustainable bubble.
High: Overvalued Network worth - Bearish
Marketcap is too much valued compared to the low ability to transact coins in terms of volume
Low : Undervalued Network worth - Bullish
Marketcap is undervalued compared to the high ability to transact coins in terms of volume
開源腳本
秉持TradingView一貫精神,這個腳本的創作者將其設為開源,以便交易者檢視並驗證其功能。向作者致敬!您可以免費使用此腳本,但請注意,重新發佈代碼需遵守我們的社群規範。
免責聲明
這些資訊和出版物並非旨在提供,也不構成TradingView提供或認可的任何形式的財務、投資、交易或其他類型的建議或推薦。請閱讀使用條款以了解更多資訊。
開源腳本
秉持TradingView一貫精神,這個腳本的創作者將其設為開源,以便交易者檢視並驗證其功能。向作者致敬!您可以免費使用此腳本,但請注意,重新發佈代碼需遵守我們的社群規範。
免責聲明
這些資訊和出版物並非旨在提供,也不構成TradingView提供或認可的任何形式的財務、投資、交易或其他類型的建議或推薦。請閱讀使用條款以了解更多資訊。