INVITE-ONLY SCRIPT
Dilip Reversal Points
This indicator is very simple, but surprisingly effective, and I haven't found any mention of something similar, so here it is. I hope it helps you in your stock trading.
What's more, is that the stock would often respond to the high and low values of that candle later on in the day. It turned out to be quite an important support and resistance level indicator for stocks which I've used in my trading ever since I discovered it.
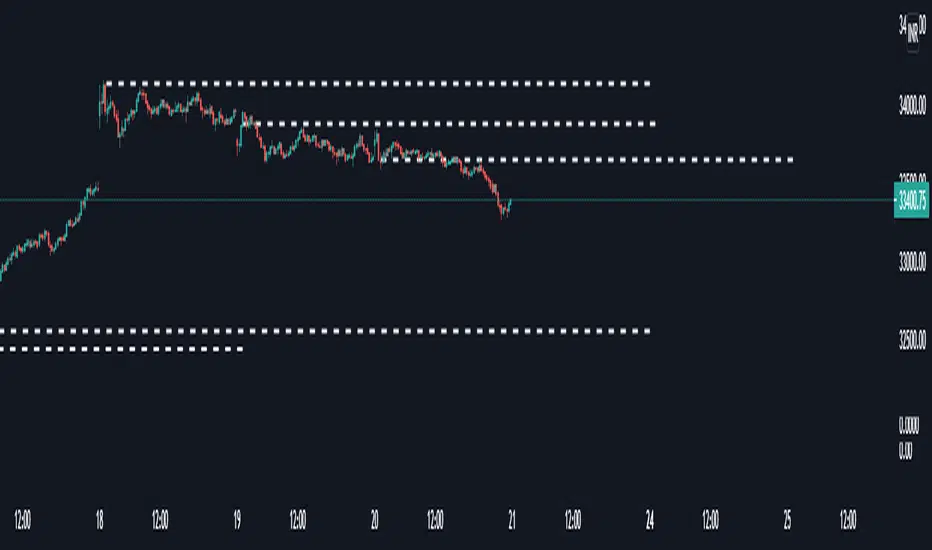
After testing it out day after day on multiple stocks, I decided to write this indicator, which not only projects the high and low values of the candle, but also the previous day's closing price.
If you find that there's another "magic candle" out there for Forex or Crypto, please let me know!
You have the option to set the "magic candle" to another time, if you want to experiment with things. White line will act as support and resistance
I hope it helps,
Note: Since Reversal Points Indicator works in ALL Segments only amounts vary across the board. The background height is set to readjust based on the highest bars. This lookback amount is adjustable by the user and it does not affect calculations what so ever.
For access, send me a DM on TradingView
What's more, is that the stock would often respond to the high and low values of that candle later on in the day. It turned out to be quite an important support and resistance level indicator for stocks which I've used in my trading ever since I discovered it.
After testing it out day after day on multiple stocks, I decided to write this indicator, which not only projects the high and low values of the candle, but also the previous day's closing price.
If you find that there's another "magic candle" out there for Forex or Crypto, please let me know!
You have the option to set the "magic candle" to another time, if you want to experiment with things. White line will act as support and resistance
I hope it helps,
Note: Since Reversal Points Indicator works in ALL Segments only amounts vary across the board. The background height is set to readjust based on the highest bars. This lookback amount is adjustable by the user and it does not affect calculations what so ever.
For access, send me a DM on TradingView
僅限邀請腳本
只有經作者授權的使用者才能訪問此腳本,且通常需付費。您可以將此腳本加入收藏,但需先向作者申請並獲得許可後才能使用 — 點擊此處了解更多。如需更多詳情,請依照作者說明或直接聯繫dilipchowdarythamma。
除非您完全信任其作者並了解腳本的工作原理,否則TradingView不建議您付費或使用腳本。您也可以在我們的社群腳本中找到免費的開源替代方案。
作者的說明
Reversal Points Indicator works in ALL Segments
提醒:在請求訪問權限之前,請閱讀僅限邀請腳本指南。
免責聲明
這些資訊和出版物並不意味著也不構成TradingView提供或認可的金融、投資、交易或其他類型的意見或建議。請在使用條款閱讀更多資訊。