OPEN-SOURCE SCRIPT
OS AO (P-unity MACD)
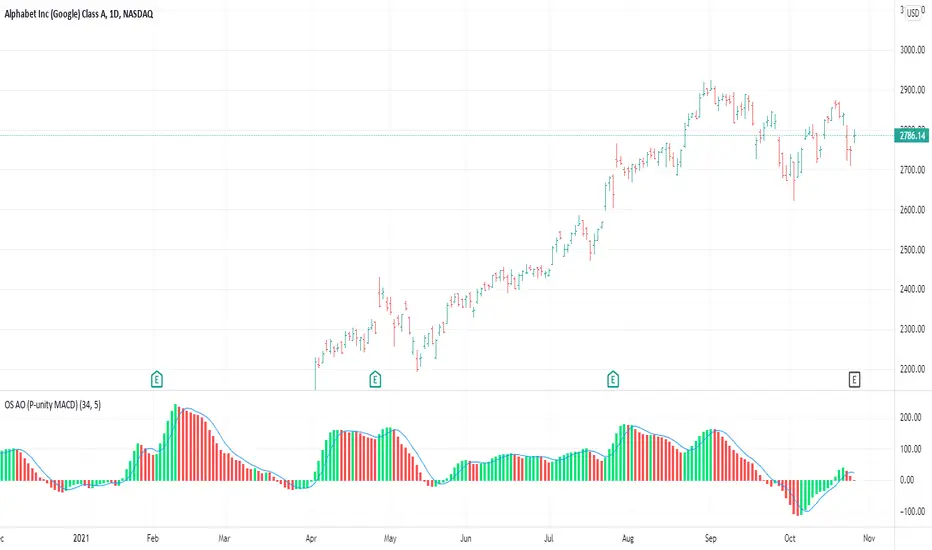
This is both the Awesome Oscillator (AO) as described in New Trading Dimensions ( NTD , book by Bill Williams ), and the Profitunity MACD described in the first edition of Trading Chaos.
The calculation for both is the same. In this case I added the 5 day SMA which is the blue line. The difference between the blue line and the AO is the AC which is also described in NTD and is usually plotted in a different indicator (AC).
This is the base for the following signals:
Zone Bar
2nd Wise Man
The signals are triggered and shown on the main chart screen through the use of OS Alligator . This indicator (AO) provides further insight in analyzing those signals by reading the AO, its current position and evolution directly.
開源腳本
秉持TradingView一貫精神,這個腳本的創作者將其設為開源,以便交易者檢視並驗證其功能。向作者致敬!您可以免費使用此腳本,但請注意,重新發佈代碼需遵守我們的社群規範。
免責聲明
這些資訊和出版物並非旨在提供,也不構成TradingView提供或認可的任何形式的財務、投資、交易或其他類型的建議或推薦。請閱讀使用條款以了解更多資訊。
免責聲明
這些資訊和出版物並非旨在提供,也不構成TradingView提供或認可的任何形式的財務、投資、交易或其他類型的建議或推薦。請閱讀使用條款以了解更多資訊。