INVITE-ONLY SCRIPT
已更新 X-Volume
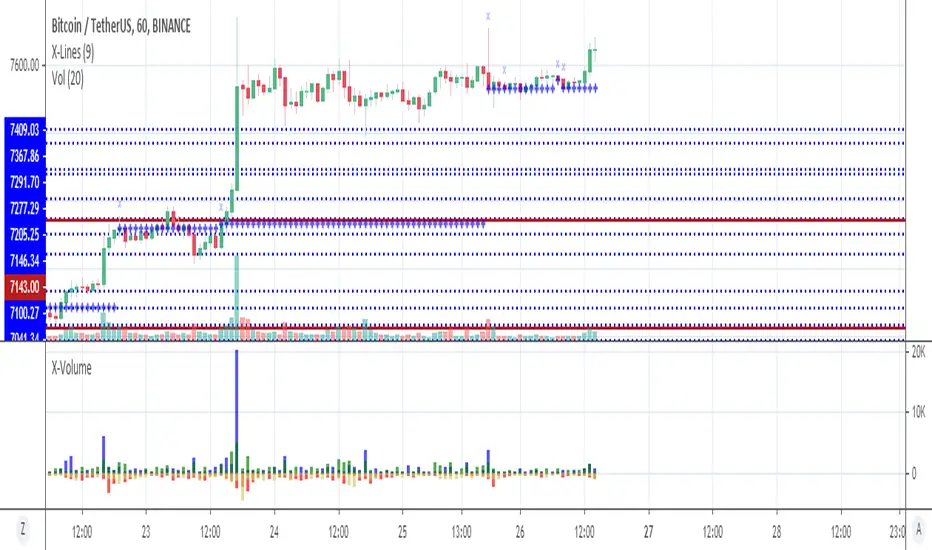
Using the indicator, you can roughly analyze the accumulation and distribution of trading volume.
發行說明
Complete instructions for working with the X-Volume indicator.Principle of operation
1) The blue line shows how many times the distribution process in the current candle differs from the previous one. Naturally, if the value is positive, the distribution process in this candle prevails over the previous one and vice versa.
2) The red line shows how many times the process of accumulation in the current candle differs from the previous one. Naturally, if the value is positive, then the accumulation process in this candle prevails over the previous one and vice versa.
Assessment of indicators
1) The accumulation is positive, and the distribution is negative (but its value with the plus sign is less than the accumulation value) - very strong accumulation (there is an active opening of market contracts that in the future will undoubtedly be distributed).
2) The accumulation is positive, and the distribution is negative (but its value with the plus sign is greater than the accumulation value) - active closing of positions.
3) Accumulation and distribution is positive (but the value of accumulation is greater than the distribution) - an active infusion of new positions with an inefficient distribution of the old in the same vector.
4) Accumulation and distribution is positive (but the accumulation value is less than the distribution) - the hard movement of the price of the fuel element (dubious price movement in this direction).
5) The distribution is positive, and the accumulation is negative (but the accumulation value with the plus sign is smaller than the distribution) -an easy price movement on the fuel cell (the true market trend at the moment).
6) The distribution is positive, and the accumulation is negative (but the accumulation value with the plus sign is greater than the distribution) - process of redistribution (when there is an active sale of contracts according to the price vector).
7) Distribution and accumulation are negative, but accumulation is less than distribution - a simple predominance of distribution according to the vector.
8) Distribution and accumulation are negative, but distribution is less than accumulation - a simple preponderance of accumulation according to the vector.
9) The distribution and accumulation are approximately the same - the repetition of the processes in the previous bar.
Example of item number 9.
發行說明
Fixed minor errors in the interface of the indicator.發行說明
Version 2.0 of the X-Volume indicator. Finally, we can more than ever deeply examine the market processes! The real-time indicator shows simply invaluable market information!
1) You can see open interest volume in contracts (if your supplier gives full information about trade volume) or its equivalent in ticks.
2) You can also analyze volume of transactions which are involved in trading process (those contracts are actively involved in pricing at the moment and can also be fuel for changing it).
3) You have opportunity to assess information about volume of currently closed transactions!
4) And finally you can see volume of newly opened contracts!
Notes:
1) The information that indicator represents is displayed as a colored histogram.
2) Histogram is displayed in both positive and negative values. However, it should be noted that negative values are only for display convenience. In fact all histogram values are positive
3) The best time frame for real time market analyzing is 1 minute.
Settings
You can change only the color of displayed volumes! In standart settings:
- - open interest volume - blue
- - new contracts - green
- - involved contracts - red
- - closed contracts - golden
More about metrics:
1) Open interest - sum of previously (or real-time) opened contracts that do not have a pair. For example purchases awaiting sale! You must understand the difference between absolute open interest and this indicator.This indicator indicates only the amount of open interest that has manifested itself in the current candle (and in current time). That is, this is not an absolute indicator. It is important that this volume data is formed not only by previously opened contracts, it can also be sum of previously opened and open in the current candle. There are also situations when this volume is formed only by those contracts that are newly open in current bar.
2) New contracts - newly opened contracts. The primary meaning is that they initially do not have a pair. The indicator of a pair for them is volume of involved contracts . It is written about him below. For example if we have 50 new contracts and 50 involved contracts there big chance that all of newly open have a pair! Thus, confirmation of absence of a pair for a new contract is open interest volume and confirmation of its presence is volume of involved contracts!
3) Involved contracts - indicator of a pair presence. So it show how much contracts has a paire in real time. The main point is that involved contracts will be used for price movement. Simply put these are contracts of those whose expense moves the price!
4) Closed contracts - shows how many contracts have closed at the moment. The primary meaning is that closed contracts either form a new volume of contracts without a pair or not (one type of contract is exchanged for another and a pair is immediately assigned to it).
免責聲明
這些資訊和出版物並不意味著也不構成TradingView提供或認可的金融、投資、交易或其他類型的意見或建議。請在使用條款閱讀更多資訊。