PROTECTED SOURCE SCRIPT
已更新 RSIEW V2 Thermal Falsecolor show Hot (Impulse) Cold (Correction)
HI BIG PLAYER AROUND THE WORLD,
here is my new creation of modified RSI Indikator.
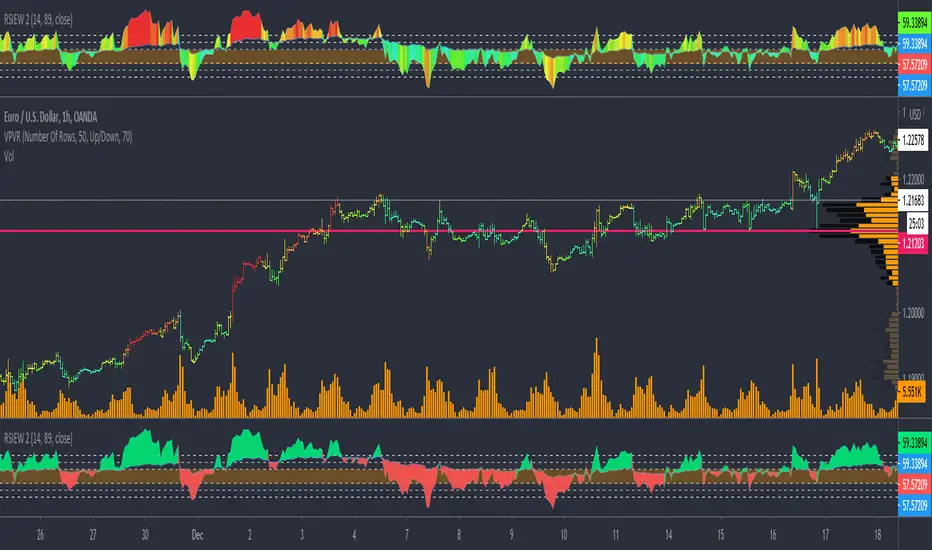
In order to the RSIEW Version 1 (look below this text) I build a thermal rainbow chart that shows the spectrum with all overbought and oversell phases. The colour spectrum can be compared with a thermal imaging camera.
In one hand, the hottest candles (going into red) show the extrem points of the chart. In trend direction this is often wave 3 of Elliott Waves theory and in correction phase it show the bounce period.
In other hand, the coldest candles (going into blue) show the weak points of the chart. In trend direction this is often a "cooling down" and in big correction phases it demonstrate frozen prices (really unattractive trading time).
Have fun with this and give me a feedback.
Of course, you are invited to follow me.
KIND REGARDS
NXT2017
here is my new creation of modified RSI Indikator.
In order to the RSIEW Version 1 (look below this text) I build a thermal rainbow chart that shows the spectrum with all overbought and oversell phases. The colour spectrum can be compared with a thermal imaging camera.
In one hand, the hottest candles (going into red) show the extrem points of the chart. In trend direction this is often wave 3 of Elliott Waves theory and in correction phase it show the bounce period.
In other hand, the coldest candles (going into blue) show the weak points of the chart. In trend direction this is often a "cooling down" and in big correction phases it demonstrate frozen prices (really unattractive trading time).
Have fun with this and give me a feedback.
Of course, you are invited to follow me.
KIND REGARDS
NXT2017
發行說明
- add manually color choose functions- fixed bugs on color
受保護腳本
此腳本以閉源形式發佈。 不過,您可以自由且不受任何限制地使用它 — 在此處了解更多資訊。
🐺 Wolfe Wave AutoPattern: nxt2017.com/ww
🎯 Elliott Wave Auto Counting: nxt2017.com/ew
💥 Impulse Scalper: nxt2017.com/im
📈 Cheapest Entry: nxt2017.com/pi
Discount Coupon:
nxtcoupon20 for -20%
🎯 Elliott Wave Auto Counting: nxt2017.com/ew
💥 Impulse Scalper: nxt2017.com/im
📈 Cheapest Entry: nxt2017.com/pi
Discount Coupon:
nxtcoupon20 for -20%
免責聲明
這些資訊和出版物並不意味著也不構成TradingView提供或認可的金融、投資、交易或其他類型的意見或建議。請在使用條款閱讀更多資訊。