OPEN-SOURCE SCRIPT
已更新 KINSKI RSI/RSX Divergence
The Relative Strength Index (RSI) is a momentum indicator that measures the magnitude of recent price changes to analyse overbought or oversold conditions. RSI values range from 0 to 100.
The Relative Strength Index (RSI) is calculated using the following formula: RSI = 100 - 100 / (1 + RS) Where RS = average gain of upward phases during the specified time frame / average loss of downward phases during the specified time frame.
An asset price is considered overbought (due for a correction) if the RSI is above 70 and oversold (due for a recovery) if it is below 30. More extreme values (80/20) are also used to avoid false readings.
In a strong uptrend, the RSI often reaches 70 and above for long periods, and downtrends can remain at 30 or below for long periods.
Divergence detection in RSI is one of the important functions of this indicator. The reason is that an RSI divergence is a more reliable signal than the overbought and oversold indicators themselves. You will get overbought and oversold signals all the time. However, the divergence is a rare event.
In general, RSI divergence means that the RSI indicator is moving in the opposite direction compared to the price. So while the price is moving, the RSI is telling us in advance to expect a change in direction.
Positive RSI divergence
A positive RSI divergence is when the price trend has lower lows and lower highs, while the RSI indicator does the opposite - higher highs and higher lows. The price continues to fall while the RSI indicator begins to rise.
Negative RSI divergence
Negative RSI divergence is the opposite of positive divergence. It applies to uptrends where the price reaches higher highs and higher lows. However, the RSI shows lower highs and lower lows - the price goes up but the RSI goes down. The price closes with higher highs and higher lows, while the RSI indicator does the opposite - lower lows and lower highs, confirming a negative divergence. As a result, there is a sharp decline in the price.
RSX Indicator - Base script: SharkCIA by Jaggedsoft (Linked in the source code)
The RSX is the noise-free variant of the more popular RSI oscillator. Typically, any indicator can be smoothed by applying a moving average. However, a major disadvantage of such a method is that there is a time lag between the indicator and the price. RSX Indicator attempts to do this without signal delay.
What distinguishes this indicator from others of this type?
- Display of RSI indicator together/alone with RSX and RSI smoothed
- display of the RSI indicator (option: "RSI: On/Off")
- display of the RSX indicator (option: "RSX: On/Off")
- display of the RSI indicator as smoothed version (option: "RSI Smoothed: On/Off")
- offers the possibility to choose between different view variants
- many settings for additional information, layout and divergence identification
- enables completely new comparison possibilities and insights with the additional RSI variants
發行說明
Convert to PineScript5發行說明
- Code optimisation: Unnecessary duplicate queries removed
發行說明
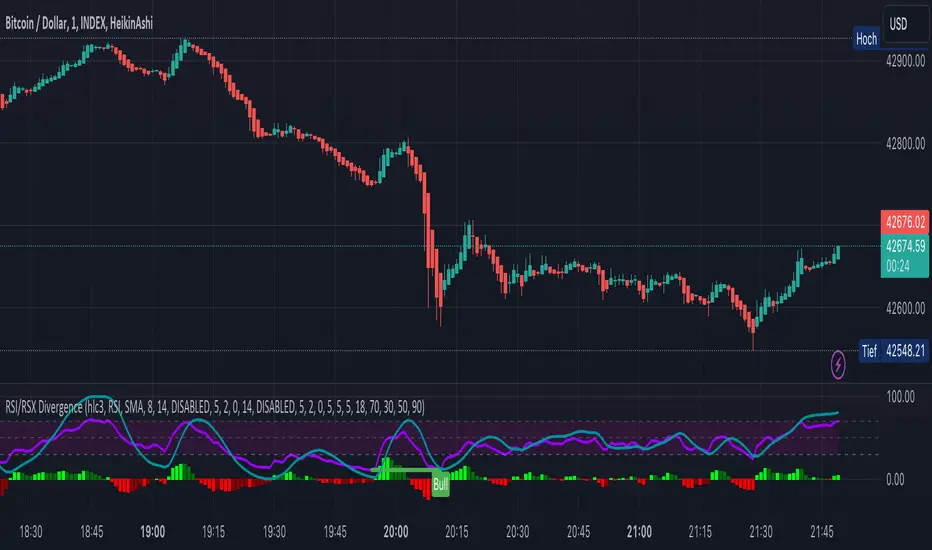
- added a new, very interesting option to display the RSI as a histogram (enabled by default).
發行說明
- For the histogram display, the variant (RSI, RSX, RSI Smoothed) can now be selected via the option 'Histogram: Variant' can be selected
發行說明
- Added new entries 'RSI Only', 'RSX Only' for the Option "Template: Visual Types"
發行說明
- add optional "RSI Laguerre"
- Option "Template: Visual Types " removed for a better overview in the settings
發行說明
- Group inputs in the same section
- Refactor function _funcCalcMA() using switch operator
- activate timeframe gaps by default
發行說明
- add optional "MFI" (Money Flow Index indicator) for more interesting comparisons.
- set the default Value of Calculation Source to 'hlc3' (Before: close). Is still adjustable.
發行說明
- Now it is possible to set additional smoothing types for all variants
- Calculation of moving averages extended with new type "Karobein"
發行說明
- Added another interesting option "Volume Based Calculation On/Off
發行說明
- I have decided to narrow the indicator back down to its originally intended variants "RSI / RSX". All previous features such as additional histogram, additional smoothing settings, volume-based calculation, highlighting of breakouts remain. I hope this will make the indicator clearer for you again.
發行說明
- add new MA Type => "TEMA" (Triple EMA)
發行說明
- Fix Syntax error: The quantities of tuple elements on each side of the assignment operator do not match. The right side has 2 but the left side has 1.
開源腳本
本著TradingView的真正精神,此腳本的創建者將其開源,以便交易者可以查看和驗證其功能。向作者致敬!雖然您可以免費使用它,但請記住,重新發佈程式碼必須遵守我們的網站規則。
My published Scripts:
de.tradingview.com/u/KINSKI/
Appreciation of my work: paypal.com/paypalme/steffenhollstein
de.tradingview.com/u/KINSKI/
Appreciation of my work: paypal.com/paypalme/steffenhollstein
免責聲明
這些資訊和出版物並不意味著也不構成TradingView提供或認可的金融、投資、交易或其他類型的意見或建議。請在使用條款閱讀更多資訊。