INVITE-ONLY SCRIPT
(10) Launch Pad VS-144
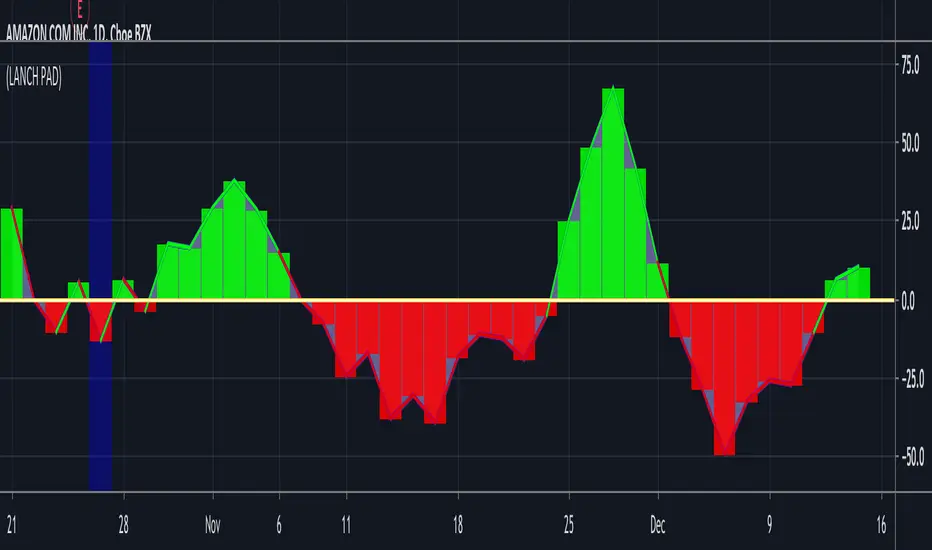
The Launch Pad Indicator, utilizes the tendency of stocks that have dropped below the center-line of a moving average, to snap back to the center-line and then exceed that center-line by approximately the same magnitude as the prior drop. This is referred to as, reversion to mean. You can see clear evidence for mean reversions in all stocks, equities and publicly traded financial instruments. Launch Pad, makes the visualization of these opportunities obvious. Stocks already in a long term up-trend offer the best targets of opportunity. This make them desirable stocks to enter and because this pullback now provides a new, more favorable entry opportunity, the pent-up demand to own this stock, combined with this new entry opportunity, often pushes these stock much higher than your entry price. Your average short-term profit expectations for this signal is a move above the zero line that is proportionally equal to the prior move below the zero line or two times the equitie's most recent low below the center line. Launch Pad alerts traders to these frequent and profitable reversion/divergent opportunities, allowing us to visualize, quantify and then capitalize on these obvious and unmistakable signals.
Launch Pad provides you with a visual conformation of the forces associated with the downward pressure exerted on the stock, moving it below the moving average as well as it’s reversion potential that the stock’s price action has produced. The positive potential is at least equal to the negative deviation from the moving average. This same indicator also clearly indicates exactly when the stocks price swings past it’s normal state, i.e., the moving average represented by the zero line. This produces an immediate indication of when the reversal of price has occurred and clear entry signals.
Launch Pad provides you with a visual conformation of the forces associated with the downward pressure exerted on the stock, moving it below the moving average as well as it’s reversion potential that the stock’s price action has produced. The positive potential is at least equal to the negative deviation from the moving average. This same indicator also clearly indicates exactly when the stocks price swings past it’s normal state, i.e., the moving average represented by the zero line. This produces an immediate indication of when the reversal of price has occurred and clear entry signals.
僅限邀請腳本
只有經作者授權的使用者才能訪問此腳本,且通常需付費。您可以將此腳本加入收藏,但需先向作者申請並獲得許可後才能使用 — 點擊此處了解更多。如需更多詳情,請依照作者說明或直接聯繫StockSwinger。
除非您完全信任其作者並了解腳本的工作原理,否則TradingView不建議您付費或使用腳本。您也可以在我們的社群腳本中找到免費的開源替代方案。
作者的說明
提醒:在請求訪問權限之前,請閱讀僅限邀請腳本指南。
免責聲明
這些資訊和出版物並不意味著也不構成TradingView提供或認可的金融、投資、交易或其他類型的意見或建議。請在使用條款閱讀更多資訊。
僅限邀請腳本
只有經作者授權的使用者才能訪問此腳本,且通常需付費。您可以將此腳本加入收藏,但需先向作者申請並獲得許可後才能使用 — 點擊此處了解更多。如需更多詳情,請依照作者說明或直接聯繫StockSwinger。
除非您完全信任其作者並了解腳本的工作原理,否則TradingView不建議您付費或使用腳本。您也可以在我們的社群腳本中找到免費的開源替代方案。
作者的說明
提醒:在請求訪問權限之前,請閱讀僅限邀請腳本指南。
免責聲明
這些資訊和出版物並不意味著也不構成TradingView提供或認可的金融、投資、交易或其他類型的意見或建議。請在使用條款閱讀更多資訊。