PROTECTED SOURCE SCRIPT
Triple-CandleStick-Strategy (AKA : TCS)
Triple Candlestick Strategy
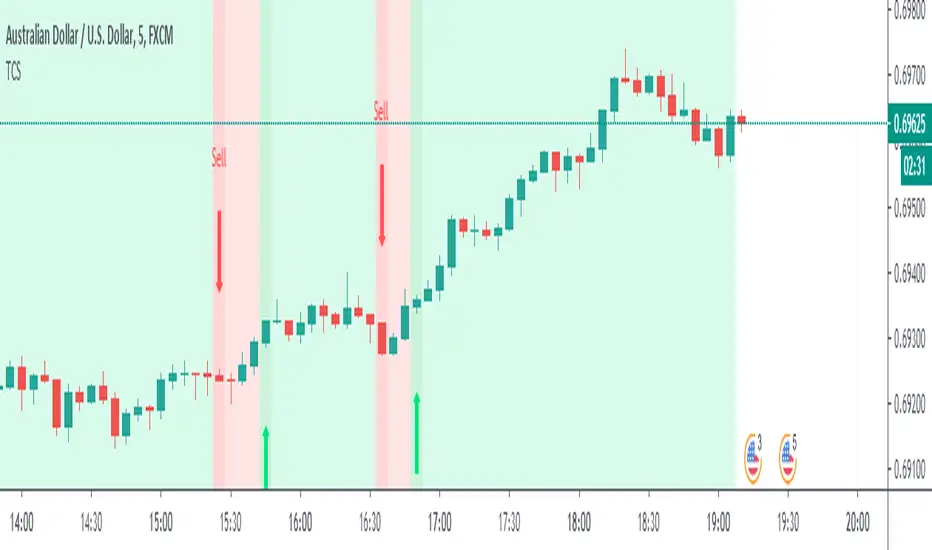
An indicator that helps us to evaluate current and future possible price direction through the background colors. Green for bullish and Red for a bearish market. This indicator shoots signals either long or short depending on which direction the triple candlestick pattern is formed. Three candles up will fire a long signal while three candles down a short signal. The light-dark shaded background color with arrows (either up or down) is the new entry at the certain direction of the market for the chosen symbol (in our case AUDUSD). Useful for glance view of overall market sentiment and one can use alert features for getting aware of the situation.
An indicator that helps us to evaluate current and future possible price direction through the background colors. Green for bullish and Red for a bearish market. This indicator shoots signals either long or short depending on which direction the triple candlestick pattern is formed. Three candles up will fire a long signal while three candles down a short signal. The light-dark shaded background color with arrows (either up or down) is the new entry at the certain direction of the market for the chosen symbol (in our case AUDUSD). Useful for glance view of overall market sentiment and one can use alert features for getting aware of the situation.
受保護腳本
此腳本以閉源形式發佈。 不過,您可以自由且不受任何限制地使用它 — 在此處了解更多資訊。
免責聲明
這些資訊和出版物並不意味著也不構成TradingView提供或認可的金融、投資、交易或其他類型的意見或建議。請在使用條款閱讀更多資訊。
免責聲明
這些資訊和出版物並不意味著也不構成TradingView提供或認可的金融、投資、交易或其他類型的意見或建議。請在使用條款閱讀更多資訊。