OPEN-SOURCE SCRIPT
已更新 Correlation Coefficient Colored Candles
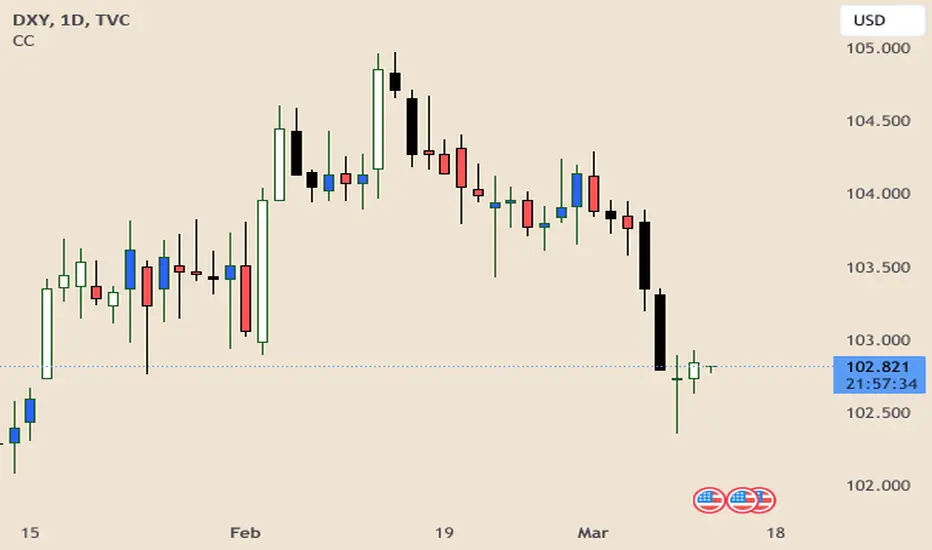
This script utilizes Tradingview's built in Correlation Coefficient indicator to calculate the correlation coefficient between two assets and changes candle colors based on the related data.
Info From Correlation Coefficient Indicator:
Correlation Coefficient (CC) is used in statistics to measure the correlation between two sets of data. In the trading world, the data sets would be stocks, etf's or any other financial instrument. The correlation between two financial instruments, simply put, is the degree in which they are related. Correlation is based on a scale of 1 to -1. The closer the Correlation Coefficient is to 1, the higher their positive correlation. The instruments will move up and down together. The higher the Correlation efficient is to -1, the more they move in opposite directions. A value at 0 indicates that there is no correlation.
This indicator allows for choosing the correlated asset, between direct and inverse correlation, the length of the series, and the correlation factor that will trigger the candles to change colors.
Example 1: You choose Direct correlation with a factor of 0.75, the candles that fall below that correlation factor will paint in your desired colors based on their closing price (up or down).
Example 2: You choose Inverse correlation with a factor of -0.75, the candles that rise above that correlation factor will paint in your desired colors based on their closing price (up or down).
Chart Shows Direct correlation of DXY and US10Y with length 3 and correlation factor of 0.75
發行說明
Updated to set min and max values for correlation factor, and added a step value.*** Example 3: NQ and DXY, Inverse Correlation, Factor 0.5. Candles will color when NQ price movement is correlated with DXY; instead of being inverse.
Length
The time period to be used in calculating the correlation.
開源腳本
秉持TradingView一貫精神,這個腳本的創作者將其設為開源,以便交易者檢視並驗證其功能。向作者致敬!您可以免費使用此腳本,但請注意,重新發佈代碼需遵守我們的社群規範。
免責聲明
這些資訊和出版物並非旨在提供,也不構成TradingView提供或認可的任何形式的財務、投資、交易或其他類型的建議或推薦。請閱讀使用條款以了解更多資訊。
開源腳本
秉持TradingView一貫精神,這個腳本的創作者將其設為開源,以便交易者檢視並驗證其功能。向作者致敬!您可以免費使用此腳本,但請注意,重新發佈代碼需遵守我們的社群規範。
免責聲明
這些資訊和出版物並非旨在提供,也不構成TradingView提供或認可的任何形式的財務、投資、交易或其他類型的建議或推薦。請閱讀使用條款以了解更多資訊。