PROTECTED SOURCE SCRIPT
Impulse Reversal + EMAs
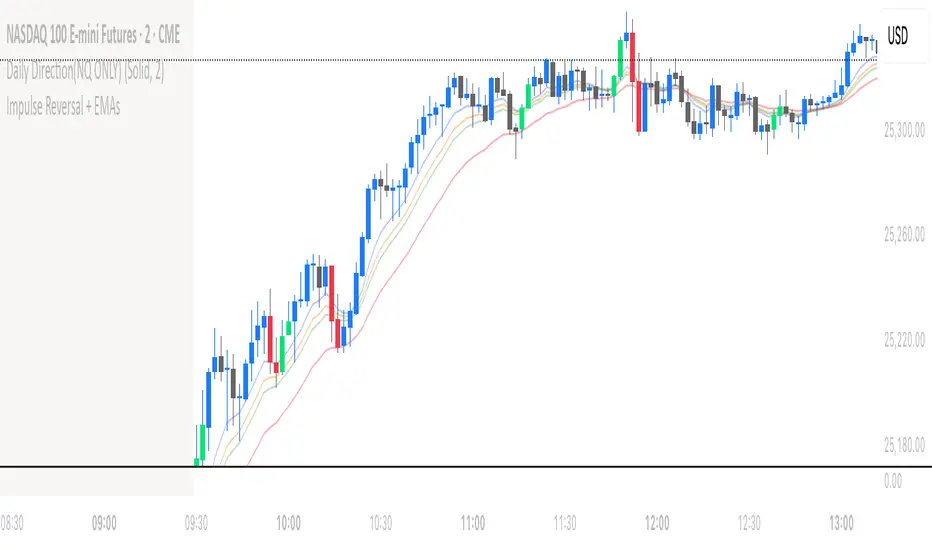
The Impulse Reversal indicator highlights key moments when momentum shifts sharply in the market.
It detects two opposite patterns:
• 🟩 Bullish Impulse: When a bearish candle is followed by a stronger bullish candle and another bullish confirmation, both bullish candles turn lime green, signaling potential upward momentum.
• 🟥 Bearish Impulse: When a bullish candle is followed by a stronger bearish candle and another bearish confirmation, both bearish candles turn red, indicating potential downward momentum.
At the same time, four EMA lines (8, 11, 13, and 21 by default) appear to help confirm the trend direction.
When all EMAs align and the impulsive color signal appears, it visually identifies high-probability reversal or continuation zones on the chart.
受保護腳本
此腳本以閉源形式發佈。 不過,您可以自由且不受任何限制地使用它 — 在此處了解更多資訊。
免責聲明
這些資訊和出版物並不意味著也不構成TradingView提供或認可的金融、投資、交易或其他類型的意見或建議。請在使用條款閱讀更多資訊。
受保護腳本
此腳本以閉源形式發佈。 不過,您可以自由且不受任何限制地使用它 — 在此處了解更多資訊。
免責聲明
這些資訊和出版物並不意味著也不構成TradingView提供或認可的金融、投資、交易或其他類型的意見或建議。請在使用條款閱讀更多資訊。