PROTECTED SOURCE SCRIPT
CAT Volume Accumulation
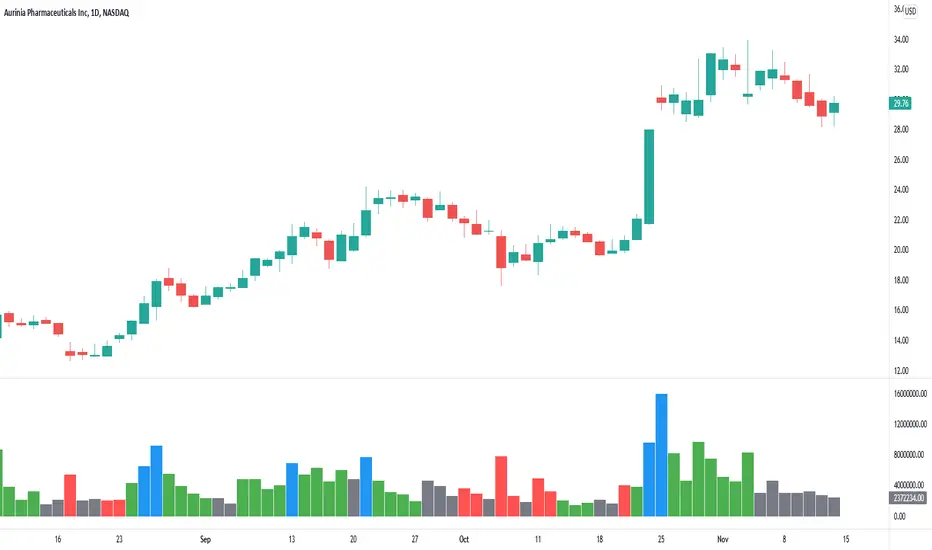
This indicator colors volume bars depending on change in price and volume. It helps traders to identify volume accumulation patterns.
The main interest for us is clusters of the blue bars and large green bars.
The blue volume bars are up days with unusually high trading volume .
Green bars are up days with normal trading volume .
Red bars are down days with elevated trading volume . It is not advisable to buy a stock on a day like that.
It makes sense to wait until a red down down is followed by a gray day, when price stop making lower low and trading volume dries down. That is a signal that bears lost momentum.
If we see a cluster of several blue bars that tells us there are institutional buyers building a position out there.
If we get a pullback that follows that volume accumulation pattern represented by several blue and large green bars that increases our chances for continuation of the move higher after a pullback.
受保護腳本
此腳本以閉源形式發佈。 不過,您可以自由使用,沒有任何限制 — 點擊此處了解更多。
Join my Telegram channel: t.me/TheCastAwayTrader
免責聲明
這些資訊和出版物並非旨在提供,也不構成TradingView提供或認可的任何形式的財務、投資、交易或其他類型的建議或推薦。請閱讀使用條款以了解更多資訊。
受保護腳本
此腳本以閉源形式發佈。 不過,您可以自由使用,沒有任何限制 — 點擊此處了解更多。
Join my Telegram channel: t.me/TheCastAwayTrader
免責聲明
這些資訊和出版物並非旨在提供,也不構成TradingView提供或認可的任何形式的財務、投資、交易或其他類型的建議或推薦。請閱讀使用條款以了解更多資訊。