OPEN-SOURCE SCRIPT
已更新 D-BoT Alpha Volume Spike
Hello traders, Let me explain the code and provide an example of how to trade using this indicator.

The code you provided is a Pine Script indicator that combines multiple technical indicators, such as Supertrend, ADX, RSI, and MFI, to generate buy and sell signals. Here's a breakdown of the code:
User Settings:
The user can adjust parameters like overbought_limit, oversold_limit, volume_multiplier, volume_ma_length, volume_spike_multiple, lookback_period, and use_extremities_confirmation according to their preference.
Calculate Supertrend:
The Supertrend indicator is calculated using three different ATR lengths (supertrend_atr_period1, supertrend_atr_period2, supertrend_atr_period3) and corresponding factors (supertrend_factor1, supertrend_factor2, supertrend_factor3).
The supertrend_value1, supertrend_value2, and supertrend_value3 represent the Supertrend values, while trend_direction1, trend_direction2, and trend_direction3 indicate the trend direction (negative for downtrend, positive for uptrend).

Candle calculations:
The high and low values are checked to identify bullish and bearish candles based on specific conditions.
Volume Spikes:
Volume spikes are detected by comparing the current volume with a median volume over a specified lookback period.
If the volume exceeds a certain multiple of the median volume and the DI+ value is greater than the DI- value, an "up" signal is generated. Similarly, if the DI- value is greater than the DI+ value, a "down" signal is generated.
Additional Filters (RSI and MFI):
Relative Strength Index (RSI) and Money Flow Index (MFI) are used as additional filters.
The RSI and MFI parameters can be adjusted according to the user's preference.
The signals generated by the volume spikes are filtered based on RSI and MFI conditions.

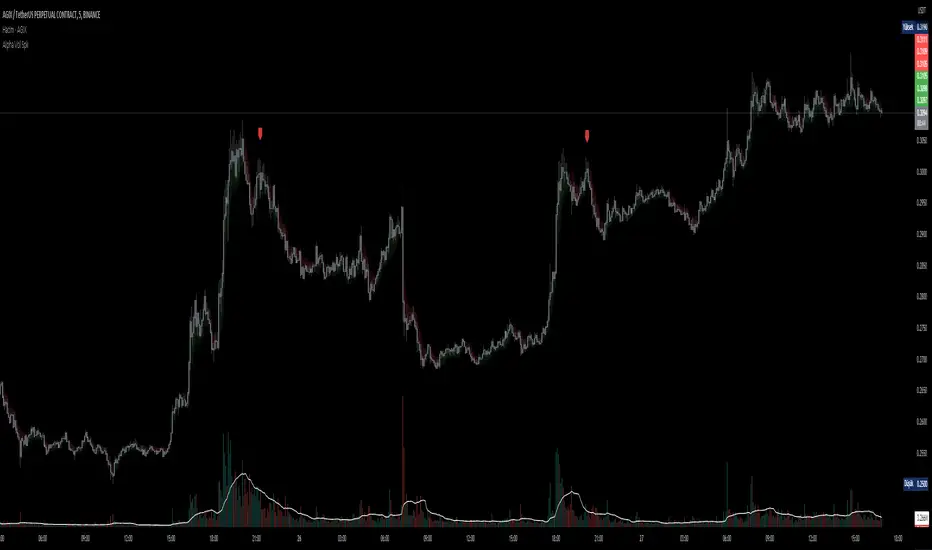
Plotting:
The indicator plots shapes (triangles) to represent buy and sell signals.
The Supertrend lines are plotted using different colors and transparency levels based on the distance from the current price.
The "bodyMiddle" plot is used for filling the area between the Supertrend lines.

Example Trade Scenario:
Let's consider an example trade scenario using this indicator:
When the indicator generates an "up" signal (trendBuy = true), indicating a potential bullish trend, and all the confirmation conditions (RSI, MFI, Supertrend) are met, you can consider opening a long position.
Conversely, when the indicator generates a "down" signal (trendSell = true), indicating a potential bearish trend, and all the confirmation conditions are met, you can consider opening a short position.
Remember, this is just an example, and it's crucial to perform thorough analysis and consider other factors before making trading decisions. It's recommended to backtest the strategy, assess risk management, and apply appropriate position sizing techniques.
Please note that the code provided is a simplified version, and there might be additional factors and considerations specific to your trading strategy that are not included in this code. *******"I have also reviewed the following indicators, and the volume calculation approaches of my friends have been very helpful in creating this indicator: "Volume Spikes [TFO]" © tradeforopp and "Volume Spikes & Growing Volume Signals With Alerts & Scanner" © FriendOfTheTrend."*******
The code you provided is a Pine Script indicator that combines multiple technical indicators, such as Supertrend, ADX, RSI, and MFI, to generate buy and sell signals. Here's a breakdown of the code:
User Settings:
The user can adjust parameters like overbought_limit, oversold_limit, volume_multiplier, volume_ma_length, volume_spike_multiple, lookback_period, and use_extremities_confirmation according to their preference.
Calculate Supertrend:
The Supertrend indicator is calculated using three different ATR lengths (supertrend_atr_period1, supertrend_atr_period2, supertrend_atr_period3) and corresponding factors (supertrend_factor1, supertrend_factor2, supertrend_factor3).
The supertrend_value1, supertrend_value2, and supertrend_value3 represent the Supertrend values, while trend_direction1, trend_direction2, and trend_direction3 indicate the trend direction (negative for downtrend, positive for uptrend).
Candle calculations:
The high and low values are checked to identify bullish and bearish candles based on specific conditions.
Volume Spikes:
Volume spikes are detected by comparing the current volume with a median volume over a specified lookback period.
If the volume exceeds a certain multiple of the median volume and the DI+ value is greater than the DI- value, an "up" signal is generated. Similarly, if the DI- value is greater than the DI+ value, a "down" signal is generated.
Additional Filters (RSI and MFI):
Relative Strength Index (RSI) and Money Flow Index (MFI) are used as additional filters.
The RSI and MFI parameters can be adjusted according to the user's preference.
The signals generated by the volume spikes are filtered based on RSI and MFI conditions.
Plotting:
The indicator plots shapes (triangles) to represent buy and sell signals.
The Supertrend lines are plotted using different colors and transparency levels based on the distance from the current price.
The "bodyMiddle" plot is used for filling the area between the Supertrend lines.
Example Trade Scenario:
Let's consider an example trade scenario using this indicator:
When the indicator generates an "up" signal (trendBuy = true), indicating a potential bullish trend, and all the confirmation conditions (RSI, MFI, Supertrend) are met, you can consider opening a long position.
Conversely, when the indicator generates a "down" signal (trendSell = true), indicating a potential bearish trend, and all the confirmation conditions are met, you can consider opening a short position.
Remember, this is just an example, and it's crucial to perform thorough analysis and consider other factors before making trading decisions. It's recommended to backtest the strategy, assess risk management, and apply appropriate position sizing techniques.
Please note that the code provided is a simplified version, and there might be additional factors and considerations specific to your trading strategy that are not included in this code. *******"I have also reviewed the following indicators, and the volume calculation approaches of my friends have been very helpful in creating this indicator: "Volume Spikes [TFO]" © tradeforopp and "Volume Spikes & Growing Volume Signals With Alerts & Scanner" © FriendOfTheTrend."*******
發行說明
Simple update!開源腳本
本著TradingView的真正精神,此腳本的創建者將其開源,以便交易者可以查看和驗證其功能。向作者致敬!雖然您可以免費使用它,但請記住,重新發佈程式碼必須遵守我們的網站規則。
免責聲明
這些資訊和出版物並不意味著也不構成TradingView提供或認可的金融、投資、交易或其他類型的意見或建議。請在使用條款閱讀更多資訊。
開源腳本
本著TradingView的真正精神,此腳本的創建者將其開源,以便交易者可以查看和驗證其功能。向作者致敬!雖然您可以免費使用它,但請記住,重新發佈程式碼必須遵守我們的網站規則。
免責聲明
這些資訊和出版物並不意味著也不構成TradingView提供或認可的金融、投資、交易或其他類型的意見或建議。請在使用條款閱讀更多資訊。