PROTECTED SOURCE SCRIPT
Short TimeFrame MAs with momentum clouds
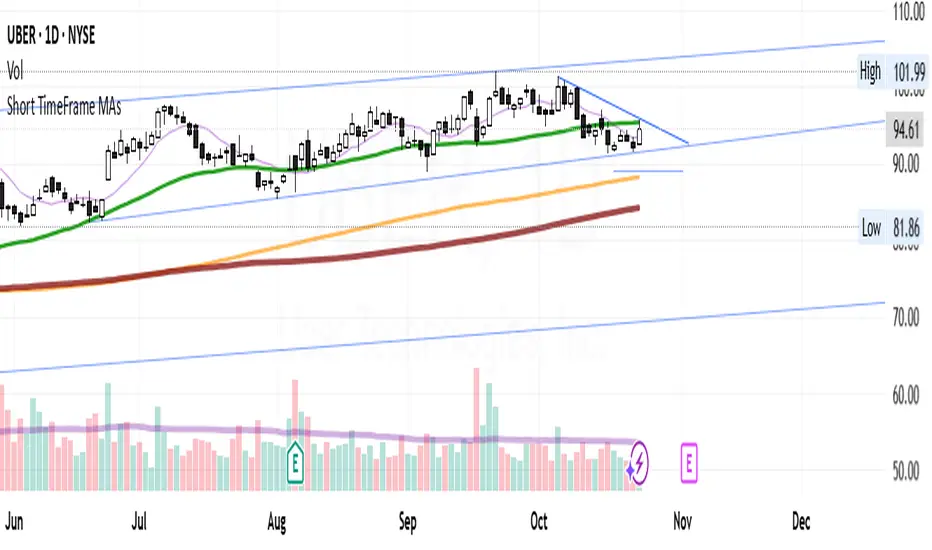
This indicator displays multiple moving averages to help identify short- and mid-term trends.
It includes four SMAs (9, 50, 150, 200) and two EMAs (21, 55) with color changes showing bullish or bearish momentum.
The area between the EMAs is filled to highlight trend direction.
An optional smoothing layer lets you apply different MA types or Bollinger Bands for additional clarity.
It’s designed to give a clear visual of overall trend strength, direction, and volatility on any timeframe.
受保護腳本
此腳本以閉源形式發佈。 不過,您可以自由使用,沒有任何限制 — 點擊此處了解更多。
免責聲明
這些資訊和出版物並非旨在提供,也不構成TradingView提供或認可的任何形式的財務、投資、交易或其他類型的建議或推薦。請閱讀使用條款以了解更多資訊。
免責聲明
這些資訊和出版物並非旨在提供,也不構成TradingView提供或認可的任何形式的財務、投資、交易或其他類型的建議或推薦。請閱讀使用條款以了解更多資訊。