OPEN-SOURCE SCRIPT
DBG X WOLONG
📊 USER GUIDE – DBG X WOLONG ALGORITHM
🎯 OVERVIEW
The DBG X WOLONG Future Algorithm is a Pine Script v5 that integrates multiple advanced technical indicators, enabling traders to analyze markets and make precise trading decisions.
⚙️ MAIN SETTINGS
🔹 Sensitivity
Value: 1–20 (Default: 6)
Function: Adjusts the sensitivity of the SuperTrend signal
Guidelines:
Low value (1–5): Fewer signals, higher accuracy
High value (15–20): More signals, but with possible noise
🎨 DISPLAY SETTINGS
🔹 Candle Colors
Version 1: Based on MACD histogram
Version 2: Based on SuperTrend
🔹 Color Themes
Theme 1: Traditional Green/Red
Theme 2: Gold/Purple
Theme 3: Blue/Orange
No Fill: No background color displayed
📊 TRADING SIGNALS
🔹 Buy/Sell Signals
BUY 🚀 appears when:
SuperTrend shifts from bearish to bullish
Closing price > SMA 13
Braid Filter confirms
SELL appears when:
SuperTrend shifts from bullish to bearish
Closing price < SMA 13
Braid Filter confirms
🔹 Reversal Signals
▲ (Up Arrow): Buy signal when RSI crosses above 30
▼ (Down Arrow): Sell signal when RSI crosses below 70
🔹 Pullback Signals
▲ Purple: Pullback in bullish trend
▼ Purple: Pullback in bearish trend
🎯 TAKE PROFIT & STOP LOSS
🔹 TP Modes
Version 1: TP based on pivot points
Version 2: TP based on regression line
Close Price: TP at candle close
🔹 TP/SL Settings
TP Ratio: 2.0 (Default)
TP Length: 150 (Default)
ATR SL Length: 10
ATR SL Risk: 1.9
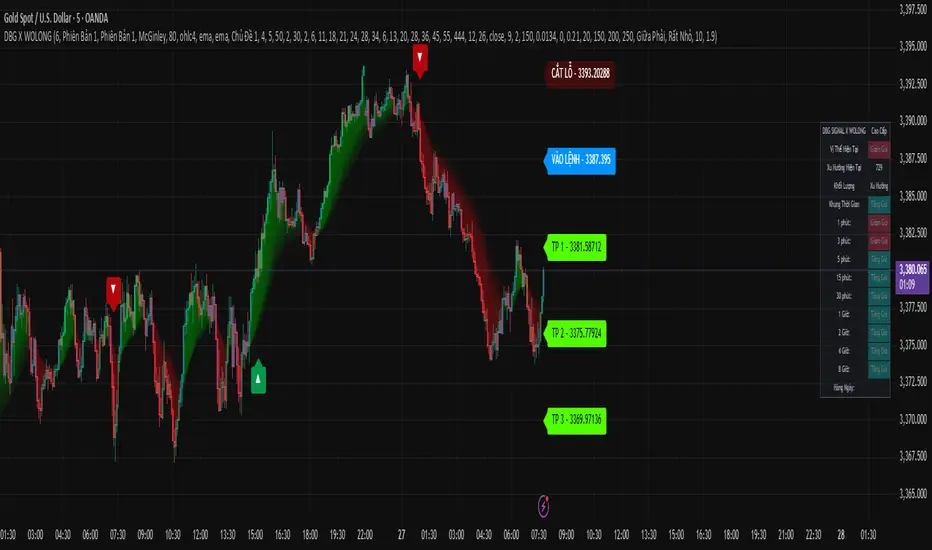
🔹 Labels Displayed
ENTRY: Entry point
STOP LOSS: Stop loss point
TP 1/2/3: 3 take profit levels
☁️ MOVING AVERAGE CLOUD
🔹 Supported MA Types
SMA – Simple Moving Average
EMA – Exponential Moving Average
WMA – Weighted Moving Average
HMA – Hull Moving Average
ALMA – Arnaud Legoux Moving Average
McGinley – McGinley Dynamic
FRAMA – Fractal Adaptive Moving Average
🔹 Cloud Cycles
Default: 2, 6, 11, 18, 21, 24, 28, 34
Customizable: All 8 cycles
🔹 Ribbon Cycles
Default: 6, 13, 20, 28, 36, 45, 55, 444
Customizable: All 8 cycles
🔧 BRAID FILTER
🔹 Function
Filters out noise signals
Confirms strong trends
🔹 Settings
MA Filter: McGinley (Recommended)
Filter Strength: 80% (Default)
📈 TRENDS & INDICATORS
🔹 SuperTrend
Main trend indicator
Generates primary buy/sell signals
🔹 Advanced Ichimoku
Tenkan-Sen: Blue line
Kijun-Sen: Orange line
Senkou Span A/B: Ichimoku cloud
🔹 Trend Tracking
Based on EMA 10 vs EMA 20
Candle colors follow trend direction
🔹 Trend Catcher
Range Filter with multiple options
Adjustable sensitivity
📊 MULTI-TIMEFRAME TREND PANEL
🔹 Displayed Timeframes
1m, 3m, 5m
15m, 30m, 1H
2H, 4H, 8H, Daily
🔹 Displayed Info
Current Position: Bullish/Bearish
Trend: Per timeframe
Volume: Current trading volume
🔹 Panel Positioning
9 selectable positions
Sizes: Large, Normal, Small, Extra Small
🚀 TRADE EXECUTION
📈 LONG ENTRY
✅ Entry Conditions
BUY 🚀 signal appears
SuperTrend turns from red to green
Price > SMA 13
Braid Filter confirms (green)
Trend Panel shows "Bullish" across multiple TFs
📊 Additional Confirmations
MACD Histogram > 0 and rising
RSI crosses above 30 (if reversal signal)
EMA Pullback shows ▲ purple
🎯 Trade Management
Entry: According to ENTRY label
Stop Loss: According to STOP LOSS label
Take Profit: TP1 → TP2 → TP3
📉 SHORT ENTRY
✅ Entry Conditions
SELL signal appears
SuperTrend turns from green to red
Price < SMA 13
Braid Filter confirms (red)
Trend Panel shows "Bearish" across multiple TFs
📊 Additional Confirmations
MACD Histogram < 0 and declining
RSI crosses below 70 (if reversal signal)
EMA Pullback shows ▼ purple
🎯 Trade Management
Entry: According to ENTRY label
Stop Loss: According to STOP LOSS label
Take Profit: TP1 → TP2 → TP3
🎛️ RECOMMENDED SETTINGS
👥 For Beginners
Sensitivity: 6
Candle Colors: Version 1
Buy/Sell Signals: ON
Reversal Signals: OFF
Trend Panel: ON
🏆 For Experienced Traders
Sensitivity: 4–8 (depending on market)
Reversal Signals: ON
Pullback: ON
All indicators: ON
ATR SL Risk: 1.5–2.0
⚡ For Scalping
Sensitivity: 8–12
Timeframes: 1m, 3m, 5m
Use only: SuperTrend + Braid Filter
Quick TP: Only TP1
📊 For Swing Trading
Sensitivity: 4–6
Timeframes: 1H, 4H, 1D
Use all: Full signals
TP: All 3 levels (TP1, TP2, TP3)
⚠️ IMPORTANT NOTES
🔴 Avoid Trading When
Signals conflict across timeframes
Market is strongly ranging/sideways
Abnormally low volume
Price is at major support/resistance zones
🟢 Prefer Trading When
At least 2–3 confirmations align
Clear trend across multiple timeframes
Strong volume surge
Breakout from consolidation zone
💡 Usage Tips
Always wait for confirmation: Never enter with just 1 signal
Risk management: Place SL according to STOP LOSS label
Follow trend panel: Prioritize overall trend
Use multiple timeframes: Analyze top-down
Backtest first: Test strategy on historical data
🛠️ TROUBLESHOOTING
❓ No signals appear
Check if inputs are enabled
Adjust sensitivity
Try switching timeframe
❓ Too many false signals
Lower sensitivity
Increase Braid Filter strength
Trade only with main trend
❓ Trend panel not showing
Enable "Display Dashboard"
Select proper panel position
Adjust panel size
📞 SUPPORT
If you encounter issues using this script, please:
Carefully read this guide
Practice on a demo account
Backtest thoroughly before live trading
📈 Wishing you successful trading! 🚀
🎯 OVERVIEW
The DBG X WOLONG Future Algorithm is a Pine Script v5 that integrates multiple advanced technical indicators, enabling traders to analyze markets and make precise trading decisions.
⚙️ MAIN SETTINGS
🔹 Sensitivity
Value: 1–20 (Default: 6)
Function: Adjusts the sensitivity of the SuperTrend signal
Guidelines:
Low value (1–5): Fewer signals, higher accuracy
High value (15–20): More signals, but with possible noise
🎨 DISPLAY SETTINGS
🔹 Candle Colors
Version 1: Based on MACD histogram
Version 2: Based on SuperTrend
🔹 Color Themes
Theme 1: Traditional Green/Red
Theme 2: Gold/Purple
Theme 3: Blue/Orange
No Fill: No background color displayed
📊 TRADING SIGNALS
🔹 Buy/Sell Signals
BUY 🚀 appears when:
SuperTrend shifts from bearish to bullish
Closing price > SMA 13
Braid Filter confirms
SELL appears when:
SuperTrend shifts from bullish to bearish
Closing price < SMA 13
Braid Filter confirms
🔹 Reversal Signals
▲ (Up Arrow): Buy signal when RSI crosses above 30
▼ (Down Arrow): Sell signal when RSI crosses below 70
🔹 Pullback Signals
▲ Purple: Pullback in bullish trend
▼ Purple: Pullback in bearish trend
🎯 TAKE PROFIT & STOP LOSS
🔹 TP Modes
Version 1: TP based on pivot points
Version 2: TP based on regression line
Close Price: TP at candle close
🔹 TP/SL Settings
TP Ratio: 2.0 (Default)
TP Length: 150 (Default)
ATR SL Length: 10
ATR SL Risk: 1.9
🔹 Labels Displayed
ENTRY: Entry point
STOP LOSS: Stop loss point
TP 1/2/3: 3 take profit levels
☁️ MOVING AVERAGE CLOUD
🔹 Supported MA Types
SMA – Simple Moving Average
EMA – Exponential Moving Average
WMA – Weighted Moving Average
HMA – Hull Moving Average
ALMA – Arnaud Legoux Moving Average
McGinley – McGinley Dynamic
FRAMA – Fractal Adaptive Moving Average
🔹 Cloud Cycles
Default: 2, 6, 11, 18, 21, 24, 28, 34
Customizable: All 8 cycles
🔹 Ribbon Cycles
Default: 6, 13, 20, 28, 36, 45, 55, 444
Customizable: All 8 cycles
🔧 BRAID FILTER
🔹 Function
Filters out noise signals
Confirms strong trends
🔹 Settings
MA Filter: McGinley (Recommended)
Filter Strength: 80% (Default)
📈 TRENDS & INDICATORS
🔹 SuperTrend
Main trend indicator
Generates primary buy/sell signals
🔹 Advanced Ichimoku
Tenkan-Sen: Blue line
Kijun-Sen: Orange line
Senkou Span A/B: Ichimoku cloud
🔹 Trend Tracking
Based on EMA 10 vs EMA 20
Candle colors follow trend direction
🔹 Trend Catcher
Range Filter with multiple options
Adjustable sensitivity
📊 MULTI-TIMEFRAME TREND PANEL
🔹 Displayed Timeframes
1m, 3m, 5m
15m, 30m, 1H
2H, 4H, 8H, Daily
🔹 Displayed Info
Current Position: Bullish/Bearish
Trend: Per timeframe
Volume: Current trading volume
🔹 Panel Positioning
9 selectable positions
Sizes: Large, Normal, Small, Extra Small
🚀 TRADE EXECUTION
📈 LONG ENTRY
✅ Entry Conditions
BUY 🚀 signal appears
SuperTrend turns from red to green
Price > SMA 13
Braid Filter confirms (green)
Trend Panel shows "Bullish" across multiple TFs
📊 Additional Confirmations
MACD Histogram > 0 and rising
RSI crosses above 30 (if reversal signal)
EMA Pullback shows ▲ purple
🎯 Trade Management
Entry: According to ENTRY label
Stop Loss: According to STOP LOSS label
Take Profit: TP1 → TP2 → TP3
📉 SHORT ENTRY
✅ Entry Conditions
SELL signal appears
SuperTrend turns from green to red
Price < SMA 13
Braid Filter confirms (red)
Trend Panel shows "Bearish" across multiple TFs
📊 Additional Confirmations
MACD Histogram < 0 and declining
RSI crosses below 70 (if reversal signal)
EMA Pullback shows ▼ purple
🎯 Trade Management
Entry: According to ENTRY label
Stop Loss: According to STOP LOSS label
Take Profit: TP1 → TP2 → TP3
🎛️ RECOMMENDED SETTINGS
👥 For Beginners
Sensitivity: 6
Candle Colors: Version 1
Buy/Sell Signals: ON
Reversal Signals: OFF
Trend Panel: ON
🏆 For Experienced Traders
Sensitivity: 4–8 (depending on market)
Reversal Signals: ON
Pullback: ON
All indicators: ON
ATR SL Risk: 1.5–2.0
⚡ For Scalping
Sensitivity: 8–12
Timeframes: 1m, 3m, 5m
Use only: SuperTrend + Braid Filter
Quick TP: Only TP1
📊 For Swing Trading
Sensitivity: 4–6
Timeframes: 1H, 4H, 1D
Use all: Full signals
TP: All 3 levels (TP1, TP2, TP3)
⚠️ IMPORTANT NOTES
🔴 Avoid Trading When
Signals conflict across timeframes
Market is strongly ranging/sideways
Abnormally low volume
Price is at major support/resistance zones
🟢 Prefer Trading When
At least 2–3 confirmations align
Clear trend across multiple timeframes
Strong volume surge
Breakout from consolidation zone
💡 Usage Tips
Always wait for confirmation: Never enter with just 1 signal
Risk management: Place SL according to STOP LOSS label
Follow trend panel: Prioritize overall trend
Use multiple timeframes: Analyze top-down
Backtest first: Test strategy on historical data
🛠️ TROUBLESHOOTING
❓ No signals appear
Check if inputs are enabled
Adjust sensitivity
Try switching timeframe
❓ Too many false signals
Lower sensitivity
Increase Braid Filter strength
Trade only with main trend
❓ Trend panel not showing
Enable "Display Dashboard"
Select proper panel position
Adjust panel size
📞 SUPPORT
If you encounter issues using this script, please:
Carefully read this guide
Practice on a demo account
Backtest thoroughly before live trading
📈 Wishing you successful trading! 🚀
開源腳本
本著TradingView的真正精神,此腳本的創建者將其開源,以便交易者可以查看和驗證其功能。向作者致敬!雖然您可以免費使用它,但請記住,重新發佈程式碼必須遵守我們的網站規則。
免責聲明
這些資訊和出版物並不意味著也不構成TradingView提供或認可的金融、投資、交易或其他類型的意見或建議。請在使用條款閱讀更多資訊。
開源腳本
本著TradingView的真正精神,此腳本的創建者將其開源,以便交易者可以查看和驗證其功能。向作者致敬!雖然您可以免費使用它,但請記住,重新發佈程式碼必須遵守我們的網站規則。
免責聲明
這些資訊和出版物並不意味著也不構成TradingView提供或認可的金融、投資、交易或其他類型的意見或建議。請在使用條款閱讀更多資訊。