OPEN-SOURCE SCRIPT
Financial Astrology Mars Speed
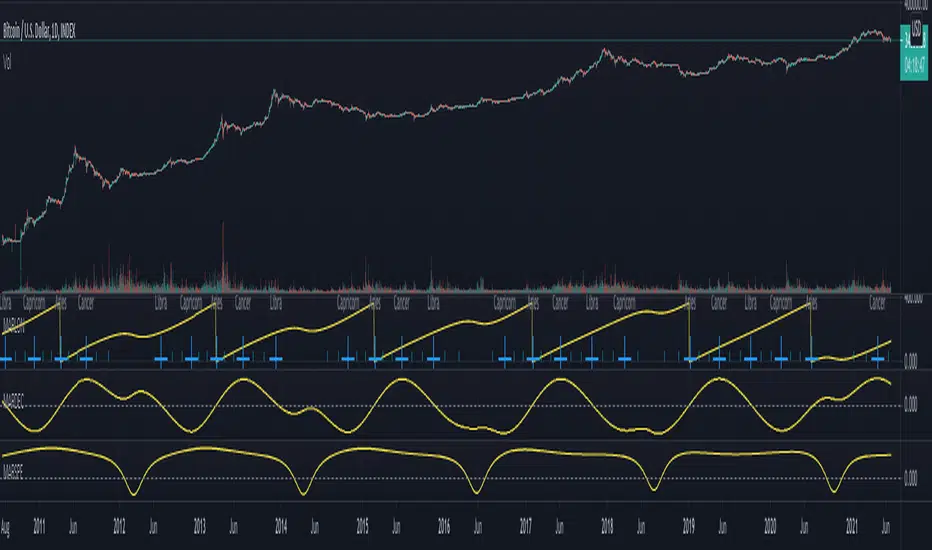
Mars speed phases (stationary and retrograde) seems to slow down the impulsive and energetic actions of traders, looking in the BTCUSD chart is very clear that during the period of Mars moving direct within the average speed around 0.6 degrees per day or above it, the price range is wider and the trend is more strong than when speed is decreasing below 0.50 degrees per day.
Surprisingly the price action acceleration don't happens at the maximum acceleration of Mars speed but after it reached the maxima around 0.75 to 0.76 degrees per day and stabilise around 0.7 for subsequent slow decrease through the course of few months to 0.62 - 0.58 daily speed range, during all this period the price action is strong. Once the Mars speed cross the 0.50 and goes into negative (in retrograde motion) the price suffers a congestion.
Note: The Mars speed indicator is based on an ephemeris array that covers years 2010 to 2030, prior or after this years the speed is not available, this daily ephemeris are based on UTC time so in order to align properly with the price bars times you should set UTC as your chart timezone.
開源腳本
秉持TradingView一貫精神,這個腳本的創作者將其設為開源,以便交易者檢視並驗證其功能。向作者致敬!您可以免費使用此腳本,但請注意,重新發佈代碼需遵守我們的社群規範。
免責聲明
這些資訊和出版物並非旨在提供,也不構成TradingView提供或認可的任何形式的財務、投資、交易或其他類型的建議或推薦。請閱讀使用條款以了解更多資訊。
免責聲明
這些資訊和出版物並非旨在提供,也不構成TradingView提供或認可的任何形式的財務、投資、交易或其他類型的建議或推薦。請閱讀使用條款以了解更多資訊。