PROTECTED SOURCE SCRIPT
Earnings X-Ray and Fundamentals Data:VSMarketTrend
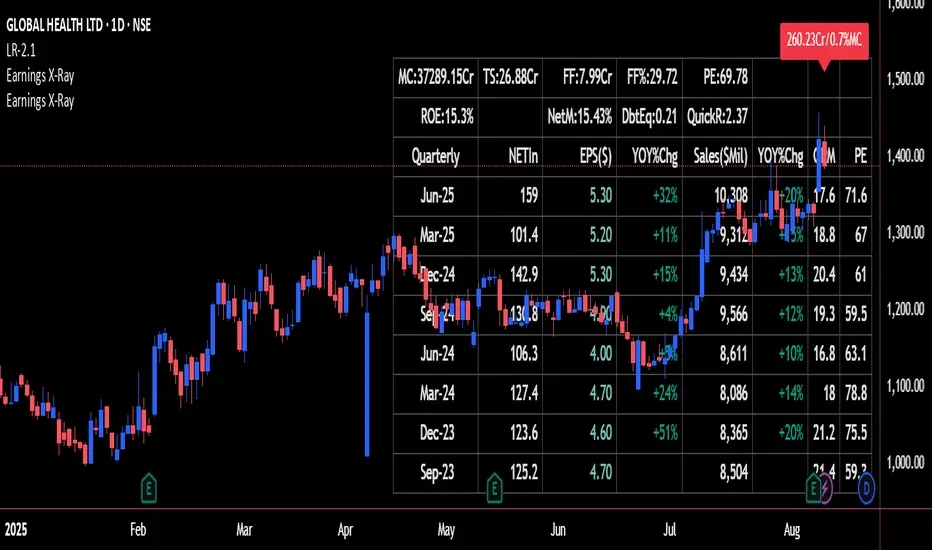
This indicator calculates essential financial metrics for stocks using TradingView's built-in functions and custom algorithms. The values are derived from fundamental data sources available on TradingView.
Key Output Metrics(YOY Basic Quaterly DATA)
MC (Market Cap): Company’s total market value (Price × Total Shares).
TS (Total Shares Outstanding): All shares (float + restricted) in circulation.
Sales: Annual revenue (TTM or latest fiscal year).
NETIn: Net income
P/E (Price-to-Earnings): Valuation ratio (Market Cap / Net Income or Price / EPS).
EPS (Earnings Per Share): Net income per share (Net Income / TS).
OPM (Operating Margin %): Core profitability (Operating Income / Revenue × 100).
Quick Ratio: Short-term liquidity ((Current Assets – Inventory) / Current Liabilities).
BVPS (Book Value Per Share): Equity per share (Shareholders’ Equity / TS).
PS (Price-to-Sales): Revenue-based valuation (Market Cap / Annual Revenue).
FCF (Free Cash Flow Per Share): Post-CapEx cash ((Operating Cash Flow – CapEx) / TS).
Data Sources & Methods
Uses TradingView’s request.financial() for income/balance sheet data (Revenue, EBITDA, etc.).
Fetches real-time metrics via request.security() (e.g., Shares Outstanding).
Normalizes data across timeframes (quarterly/annual).

Disclaimer
Not financial advice. Verify with official filings before trading.
Key Output Metrics(YOY Basic Quaterly DATA)
MC (Market Cap): Company’s total market value (Price × Total Shares).
TS (Total Shares Outstanding): All shares (float + restricted) in circulation.
Sales: Annual revenue (TTM or latest fiscal year).
NETIn: Net income
P/E (Price-to-Earnings): Valuation ratio (Market Cap / Net Income or Price / EPS).
EPS (Earnings Per Share): Net income per share (Net Income / TS).
OPM (Operating Margin %): Core profitability (Operating Income / Revenue × 100).
Quick Ratio: Short-term liquidity ((Current Assets – Inventory) / Current Liabilities).
BVPS (Book Value Per Share): Equity per share (Shareholders’ Equity / TS).
PS (Price-to-Sales): Revenue-based valuation (Market Cap / Annual Revenue).
FCF (Free Cash Flow Per Share): Post-CapEx cash ((Operating Cash Flow – CapEx) / TS).
Data Sources & Methods
Uses TradingView’s request.financial() for income/balance sheet data (Revenue, EBITDA, etc.).
Fetches real-time metrics via request.security() (e.g., Shares Outstanding).
Normalizes data across timeframes (quarterly/annual).
Disclaimer
Not financial advice. Verify with official filings before trading.
受保護腳本
此腳本以閉源形式發佈。 不過,您可以自由使用,沒有任何限制 — 點擊此處了解更多。
免責聲明
這些資訊和出版物並非旨在提供,也不構成TradingView提供或認可的任何形式的財務、投資、交易或其他類型的建議或推薦。請閱讀使用條款以了解更多資訊。
受保護腳本
此腳本以閉源形式發佈。 不過,您可以自由使用,沒有任何限制 — 點擊此處了解更多。
免責聲明
這些資訊和出版物並非旨在提供,也不構成TradingView提供或認可的任何形式的財務、投資、交易或其他類型的建議或推薦。請閱讀使用條款以了解更多資訊。