PROTECTED SOURCE SCRIPT
已更新 Trend Strength Indicator
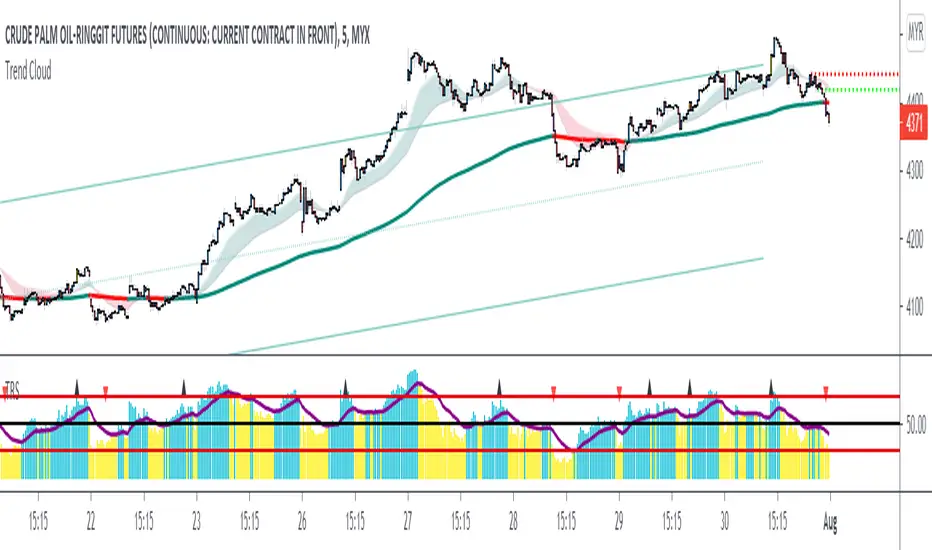
How to use?
1) The purple line summarizes the overall trend strength.
If the purple line is above 50, the market is considered to be bullish
If the purple line is below 50, the market is then considered to be bearish
Buy-Long position can be considered when the purple line is crossing up the 50-line and exit-long position can be considered vice versa.
However it is best to let the purple line to test the 50 line after crossing.
2) Each bar represents the each price movement strength index.
If the bar is above the purple line, the bar's color will become blue, indicating that the price is gaining momentum.
If the bar is below the purple line, the bar's color will turn to yellow, indicating the prices is losing momentum.
Default setting is period : 20, average : 20. It can be customized based on trading style and risk tolerance.
發行說明
Changed default setting from 20/20 to 14/14Change lower base from 20 to 0
發行說明
Adjusted the precision for divergence 發行說明
1) Updated calculation coding and default setting (14/14 to 14/20) to reduce noise2) Add up color bar coding. When Average line crosses up 50 line, bar color will turn to yellow and turns to purple when crosses down 50-line
發行說明
1) Updated name from Trend Strength Indicator to Trend Relative Strength2) Introduced input for average up & average down control
受保護腳本
此腳本以閉源形式發佈。 不過,您可以自由使用,沒有任何限制 — 點擊此處了解更多。
免責聲明
這些資訊和出版物並非旨在提供,也不構成TradingView提供或認可的任何形式的財務、投資、交易或其他類型的建議或推薦。請閱讀使用條款以了解更多資訊。
免責聲明
這些資訊和出版物並非旨在提供,也不構成TradingView提供或認可的任何形式的財務、投資、交易或其他類型的建議或推薦。請閱讀使用條款以了解更多資訊。