INVITE-ONLY SCRIPT
已更新 Killpips Acceleration
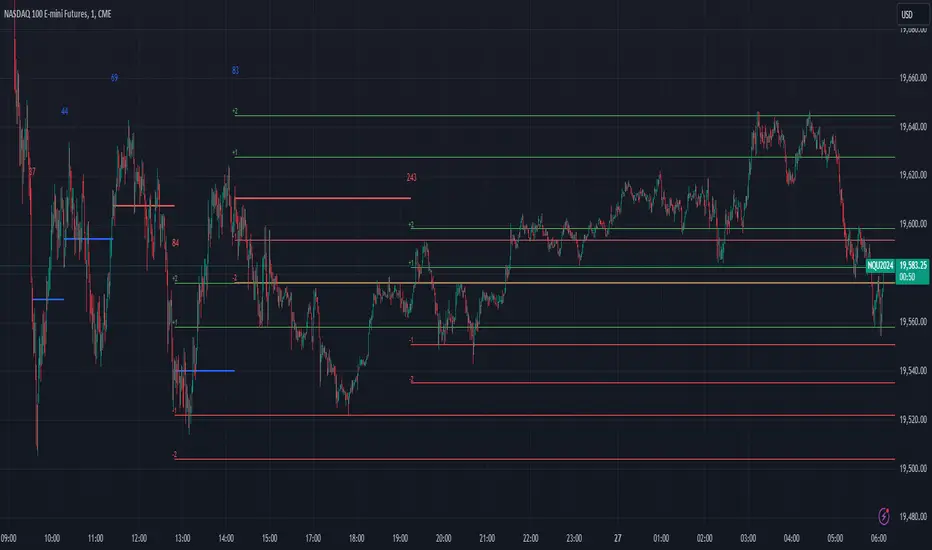
Dynamic action levels for tracking market reaction zones using a proprietary algorithm.
Settings
The acceleration value is automatically calculated every day. For a custom acceleration value, you can adjust it in the settings. Custom settings may be shared on the discord server if warranted. Setting this value to zero enables the auto-calculation.
Using the Indicator
As data is received, the indicators adjusts it's calculation for the next action levels. Once the calculation is complete, a horizontal line is drawn as a decision price level. ATR levels are wrapped around the decision price level for additional reaction levels. As price approaches these levels, be cautious with your entries and exits while looking for price reactions. The calculated horizontal line can represent both support and resistance.
The shorter the calculated horizontal line, the stronger the reaction zone. As horizontal lines shift to higher prices, it indicates long market interest. Shorter lines with increasing price levels indicates a strong correlation to price change.
Generally, near the end of a segment, especially shorter segments, as the calculated horizontal line is drawn, we're looking for a market reaction.
Longer segments represent a slowdown in market activity with less reaction.
發行說明
Added the ability to customize the color and styles僅限邀請腳本
僅作者批准的使用者才能訪問此腳本。您需要申請並獲得使用許可,通常需在付款後才能取得。更多詳情,請依照作者以下的指示操作,或直接聯絡wmarkwilkinson。
請注意,此私人、僅限受邀使用者使用的腳本未經腳本審核員審核,其是否符合社群規範尚待確定。 TradingView不建議在未完全信任作者並了解其運作方式的情況下購買或使用腳本。您也可以在我們的社群腳本中找到免費的開源替代方案。
作者的說明
This indicator is available for members of the discord server.
免責聲明
這些資訊和出版物並非旨在提供,也不構成TradingView提供或認可的任何形式的財務、投資、交易或其他類型的建議或推薦。請閱讀使用條款以了解更多資訊。
僅限邀請腳本
僅作者批准的使用者才能訪問此腳本。您需要申請並獲得使用許可,通常需在付款後才能取得。更多詳情,請依照作者以下的指示操作,或直接聯絡wmarkwilkinson。
請注意,此私人、僅限受邀使用者使用的腳本未經腳本審核員審核,其是否符合社群規範尚待確定。 TradingView不建議在未完全信任作者並了解其運作方式的情況下購買或使用腳本。您也可以在我們的社群腳本中找到免費的開源替代方案。
作者的說明
This indicator is available for members of the discord server.
免責聲明
這些資訊和出版物並非旨在提供,也不構成TradingView提供或認可的任何形式的財務、投資、交易或其他類型的建議或推薦。請閱讀使用條款以了解更多資訊。