INVITE-ONLY SCRIPT
ADX histogram with SMA
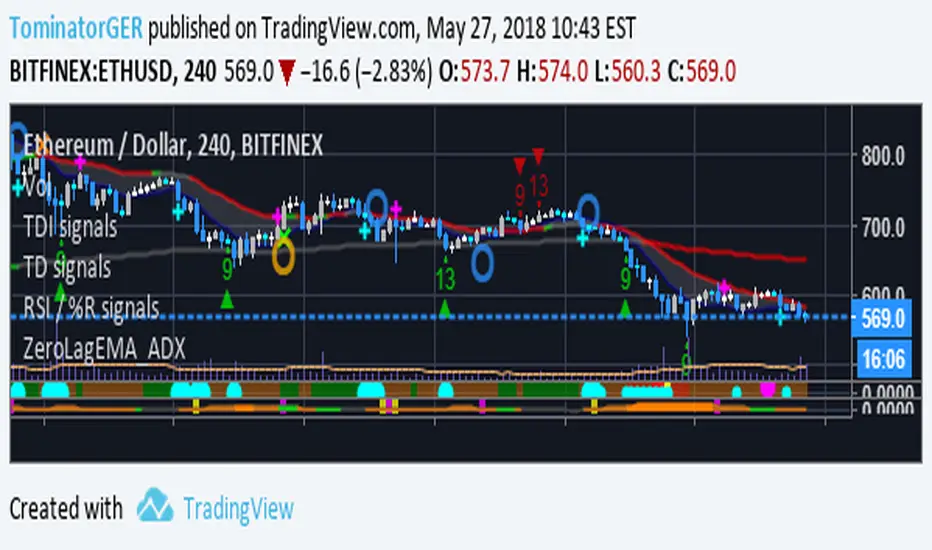
This indicator shows a histogram of the ADX with the following colors:
Additionally i have added a SMA of the ADX. The crossings of both are shown with a background color:
The indicator is optimated for small browser windows or multiple chart layouts where you have not much space left for your indicators but you also want to read the indicator signals.
For access please leave a comment.
Please provide feedback.
- Background gray => ADX under configured lower level which means no trend is present
- Background dark orange => ADX between lower and upper level and down trend is present
- Background orange => ADX between over upper level and down trend is overheated
- Background dark green => ADX between lower and upper level and up trend is present
- Background lime => ADX between over upper level and up trend is overheated
Additionally i have added a SMA of the ADX. The crossings of both are shown with a background color:
- yellow => ADX crossed SMA line upward which is the case with rising trend
- fuchsia => ADX crossed SMA line downward which is the case with falling trend
The indicator is optimated for small browser windows or multiple chart layouts where you have not much space left for your indicators but you also want to read the indicator signals.
For access please leave a comment.
Please provide feedback.
僅限邀請腳本
僅作者批准的使用者才能訪問此腳本。您需要申請並獲得使用許可,通常需在付款後才能取得。更多詳情,請依照作者以下的指示操作,或直接聯絡TominatorGER。
TradingView不建議在未完全信任作者並了解其運作方式的情況下購買或使用腳本。您也可以在我們的社群腳本中找到免費的開源替代方案。
作者的說明
免責聲明
這些資訊和出版物並非旨在提供,也不構成TradingView提供或認可的任何形式的財務、投資、交易或其他類型的建議或推薦。請閱讀使用條款以了解更多資訊。
僅限邀請腳本
僅作者批准的使用者才能訪問此腳本。您需要申請並獲得使用許可,通常需在付款後才能取得。更多詳情,請依照作者以下的指示操作,或直接聯絡TominatorGER。
TradingView不建議在未完全信任作者並了解其運作方式的情況下購買或使用腳本。您也可以在我們的社群腳本中找到免費的開源替代方案。
作者的說明
免責聲明
這些資訊和出版物並非旨在提供,也不構成TradingView提供或認可的任何形式的財務、投資、交易或其他類型的建議或推薦。請閱讀使用條款以了解更多資訊。