INVITE-ONLY SCRIPT
DASM MACD
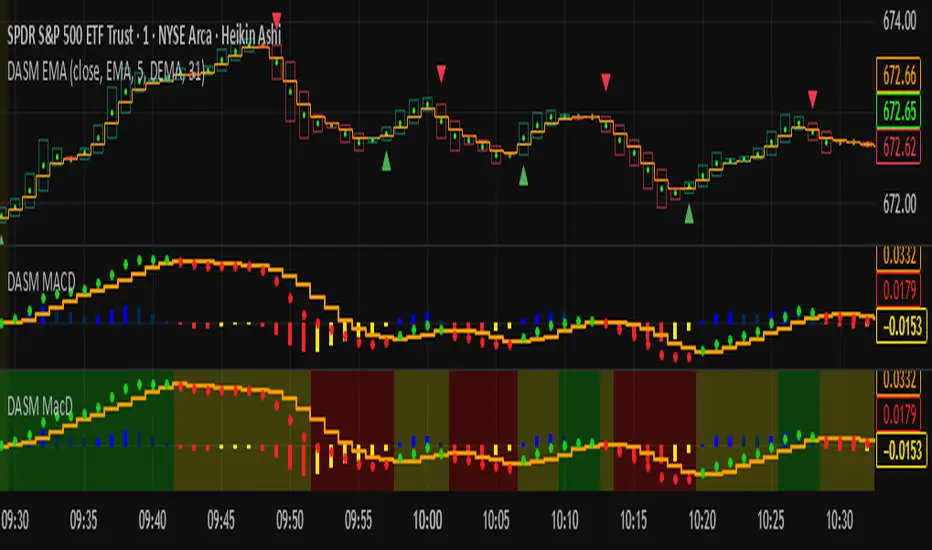
MACD rules:
- The main trend is bullish when the MACD is above the zero line, and bearish when it’s below.
- The histogram shows when a trend starts and when it’s losing strength.
- The background color highlights the trend direction.
- The EMA is easy to read — green means buy, red means sell.
僅限邀請腳本
僅作者批准的使用者才能訪問此腳本。您需要申請並獲得使用許可,通常需在付款後才能取得。更多詳情,請依照作者以下的指示操作,或直接聯絡DASMCODE。
TradingView不建議在未完全信任作者並了解其運作方式的情況下購買或使用腳本。您也可以在我們的社群腳本中找到免費的開源替代方案。
作者的說明
MACD rules:
The main trend is bullish when the MACD is above the zero line, and bearish when it’s below.
The histogram shows when a trend starts and when it’s losing strength.
The background color highlights the trend direction.
The EMA is easy to read
免責聲明
這些資訊和出版物並非旨在提供,也不構成TradingView提供或認可的任何形式的財務、投資、交易或其他類型的建議或推薦。請閱讀使用條款以了解更多資訊。