OPEN-SOURCE SCRIPT
M2 Global Liquidity Index (Candles)
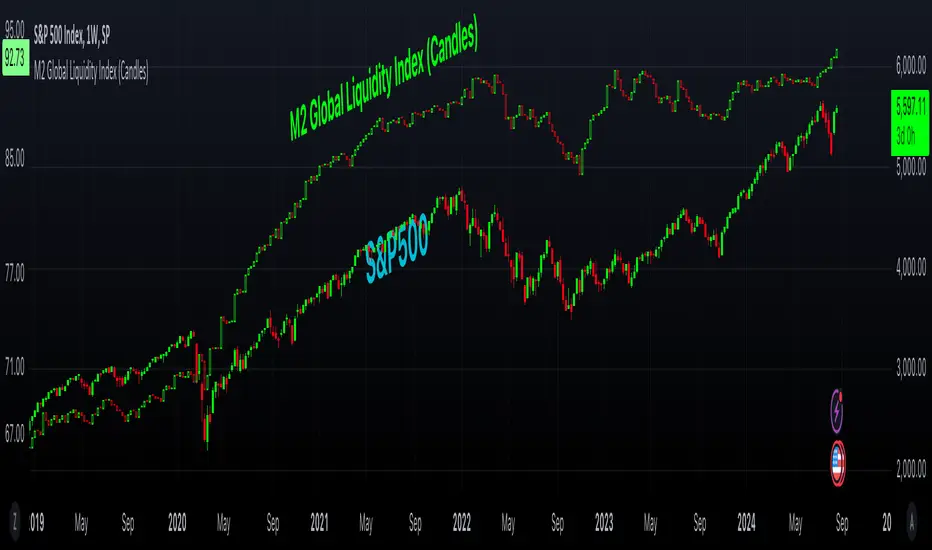
M2 Global Liquidity Index (Candles)
In this enhanced version of the original M2 Global Liquidity Index script by Mik3Christ3ns3n, I've taken the foundational concept and expanded its capabilities for more in-depth analysis and user flexibility. This updated script aggregates M2 money supply data from major global economies—China, the U.S., the Eurozone, Japan, and the U.K.—adjusted by their respective exchange rates, into a customizable global liquidity index.
Key Enhancements:
Candlestick Visualization:
• Instead of a simple line chart, I've implemented a candlestick chart, providing a more detailed representation of liquidity trends with open, high, low, and close values for each period. This allows traders to analyze the index with the same technical tools used for price charts.
Customizable Components:
• Users can now select which components (M2 data and exchange rates) to include in the index calculation, giving you the flexibility to tailor the index to specific economic factors or regions of interest.
Dynamic Color Coding:
• Candles are color-coded based on their performance (bullish or bearish), with customized wick and border colors to enhance visual clarity, making it easier to spot liquidity trends at a glance.
Overlay Option:
• This script is designed to be an overlay, allowing you to plot the Global Liquidity Index directly on your price charts, facilitating comparison between liquidity trends and asset prices.
This enhanced script is ideal for traders and analysts who want a deeper understanding of global liquidity trends and their impact on financial markets.
開源腳本
秉持TradingView一貫精神,這個腳本的創作者將其設為開源,以便交易者檢視並驗證其功能。向作者致敬!您可以免費使用此腳本,但請注意,重新發佈代碼需遵守我們的社群規範。
免責聲明
這些資訊和出版物並非旨在提供,也不構成TradingView提供或認可的任何形式的財務、投資、交易或其他類型的建議或推薦。請閱讀使用條款以了解更多資訊。
開源腳本
秉持TradingView一貫精神,這個腳本的創作者將其設為開源,以便交易者檢視並驗證其功能。向作者致敬!您可以免費使用此腳本,但請注意,重新發佈代碼需遵守我們的社群規範。
免責聲明
這些資訊和出版物並非旨在提供,也不構成TradingView提供或認可的任何形式的財務、投資、交易或其他類型的建議或推薦。請閱讀使用條款以了解更多資訊。