OPEN-SOURCE SCRIPT
Acceleration Bands
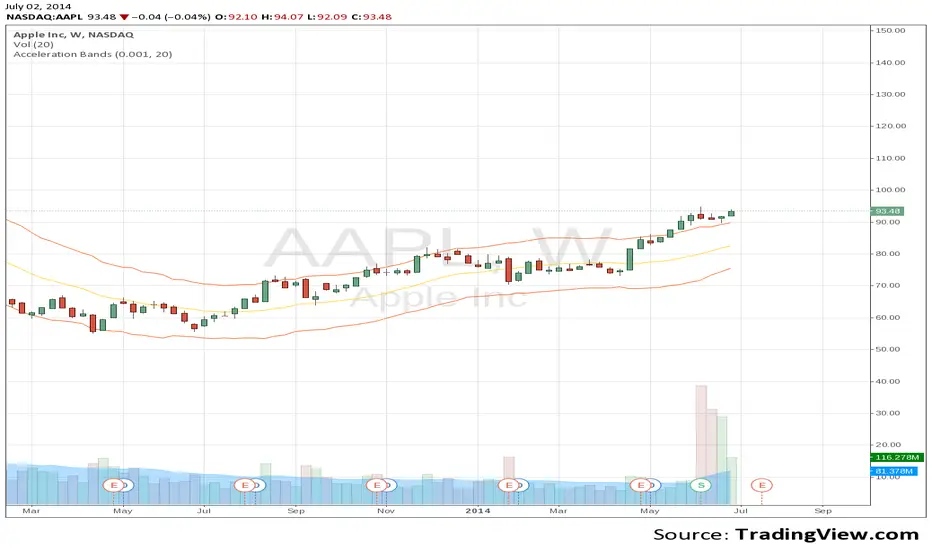
Price Headley\'s Acceleration Bands serve as a trading envelope that factor in a stock\'s typical volatility over standard settings of 20 or 80 bars. They can be used across any time frame, though Headley prefers to use them most across weekly and monthly timeframes as breakout indicators outside these bands, while using the shorter time frames to define likely support and resistance levels at the lower and upper Acceleration Bands. Acceleration Bands are plotted around a simple moving average as the midpoint, and the upper and lower bands are of equal distance from this midpoint.
swingtracker.com/content.php?content=technical_accband
forex-indicators.net/acceleration-bands
swingtracker.com/content.php?content=technical_accband
forex-indicators.net/acceleration-bands
開源腳本
本著TradingView的真正精神,此腳本的創建者將其開源,以便交易者可以查看和驗證其功能。向作者致敬!雖然您可以免費使用它,但請記住,重新發佈程式碼必須遵守我們的網站規則。
免責聲明
這些資訊和出版物並不意味著也不構成TradingView提供或認可的金融、投資、交易或其他類型的意見或建議。請在使用條款閱讀更多資訊。
免責聲明
這些資訊和出版物並不意味著也不構成TradingView提供或認可的金融、投資、交易或其他類型的意見或建議。請在使用條款閱讀更多資訊。