INVITE-ONLY SCRIPT
Boss Oscillator [Crypto Trading FR]
The Boss Oscillator is a momentum indicator using support and resistance levels and refers to the position of the closing price in relationship to the price range over a period of time. It is calculated as the difference between the close and the low, divided by the price range (the difference between the high and low over a certain period of time). Thus, the indicator takes a value between 0,1 and -0,1 and is expressed in percentage points.
A Boss Oscillator value over 0,92% (yellow) indicates that the security is OVERBOUGHT and a crossover below that threshold represents a potential sell signal while a value below -0,92% (red) indicates that the security is OVERSOLD and a crossover above that threshold indicates a potential buy signal.
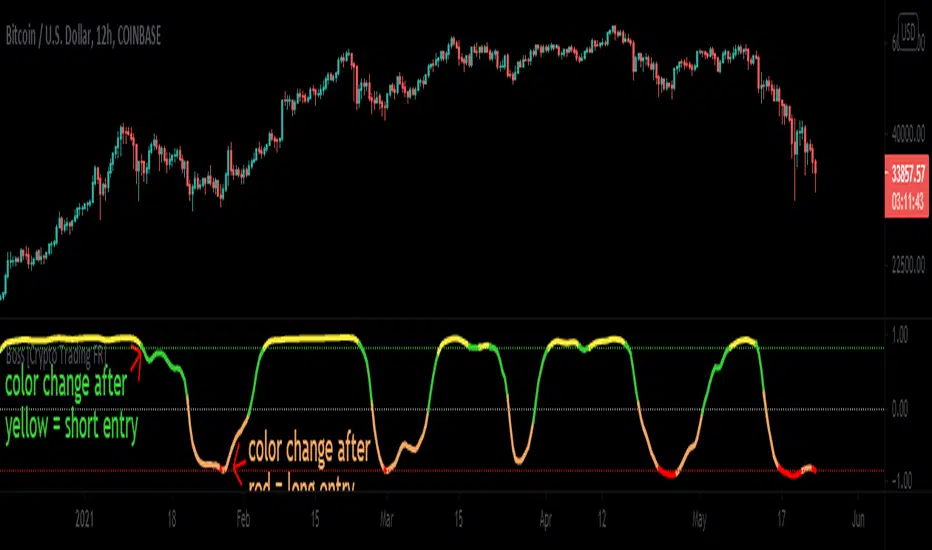
Optimal conditions for considering a short Entry
During an uptrend, sell when you get a short signal: the "Boss Oscillator" (yellow overbought line) drops below 0,92% (higher band) and is turning green.
Optimal conditions for considering a long Entry
During a downtrend, buy when you get a long signal: the "Boss Oscillator" (red oversold line) rises above -0,92% (lower band) and is turning orange.
Triggers for scaling/adding into your position = Keeping in mind that this oscillator on its own is not meant to be the sole reason for taking a trade, here are some triggers you will see for getting into position (preferably with the optimal conditions being met) The Oscillator flips from yellow color into a red slide and vise versa. The Oscillator crosses the midline up or down. The Oscillaor begins going up/down and is crossing the midline levels at 0. The Oscillator shift from one color to the next in the favored direction of the trade you wish to make.
Signs for taking profit and protecting your trade = the Boss Oscillator changes colors at the top or bottom.
A Boss Oscillator value over 0,92% (yellow) indicates that the security is OVERBOUGHT and a crossover below that threshold represents a potential sell signal while a value below -0,92% (red) indicates that the security is OVERSOLD and a crossover above that threshold indicates a potential buy signal.
Optimal conditions for considering a short Entry
During an uptrend, sell when you get a short signal: the "Boss Oscillator" (yellow overbought line) drops below 0,92% (higher band) and is turning green.
Optimal conditions for considering a long Entry
During a downtrend, buy when you get a long signal: the "Boss Oscillator" (red oversold line) rises above -0,92% (lower band) and is turning orange.
Triggers for scaling/adding into your position = Keeping in mind that this oscillator on its own is not meant to be the sole reason for taking a trade, here are some triggers you will see for getting into position (preferably with the optimal conditions being met) The Oscillator flips from yellow color into a red slide and vise versa. The Oscillator crosses the midline up or down. The Oscillaor begins going up/down and is crossing the midline levels at 0. The Oscillator shift from one color to the next in the favored direction of the trade you wish to make.
Signs for taking profit and protecting your trade = the Boss Oscillator changes colors at the top or bottom.
僅限邀請腳本
僅作者批准的使用者才能訪問此腳本。您需要申請並獲得使用許可,通常需在付款後才能取得。更多詳情,請依照作者以下的指示操作,或直接聯絡CryptoTradingFrance。
TradingView不建議在未完全信任作者並了解其運作方式的情況下購買或使用腳本。您也可以在我們的社群腳本中找到免費的開源替代方案。
作者的說明
THE PRICING IS A SYMBOLIC 0,50$/DAY + or 15$/MONTH. To get your access visit: https://t.me/cryptotradingfrancebot and select "Boss Oscillator"
免責聲明
這些資訊和出版物並非旨在提供,也不構成TradingView提供或認可的任何形式的財務、投資、交易或其他類型的建議或推薦。請閱讀使用條款以了解更多資訊。