OPEN-SOURCE SCRIPT
R.E.Signal V3.0: Updated version to work with Key Hidden Levels
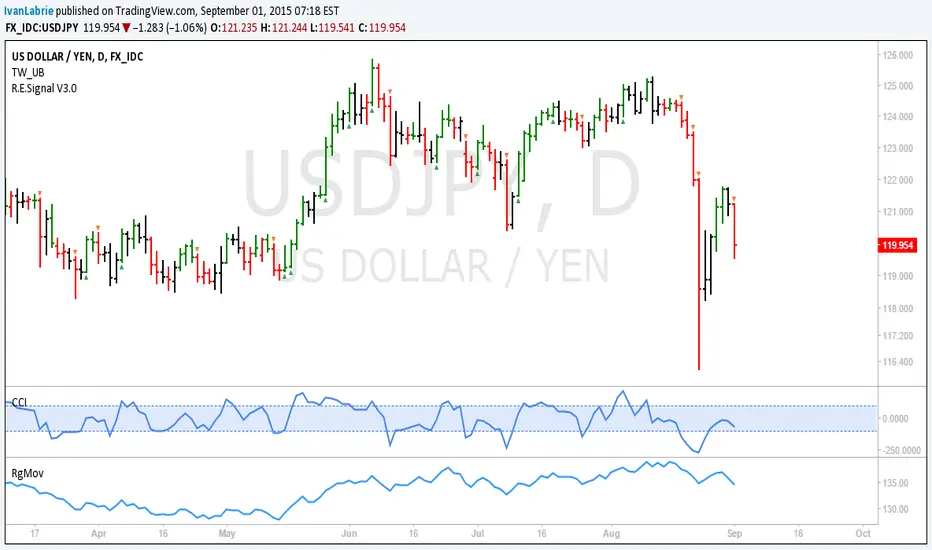
Hi, I updated the code to be able to use Tim West's TW_UB indicator, which helps a lot with seeing price waves, coloring bars that form new highs green, new lows red and inside and outside bars red.
The indicator now only plots range expansion bars, with a triangle shape above or below each bar to make it visually clear.
Hope you find this of use.
Cheers,
Ivan.
The indicator now only plots range expansion bars, with a triangle shape above or below each bar to make it visually clear.
Hope you find this of use.
Cheers,
Ivan.
開源腳本
本著TradingView的真正精神,此腳本的創建者將其開源,以便交易者可以查看和驗證其功能。向作者致敬!雖然您可以免費使用它,但請記住,重新發佈程式碼必須遵守我們的網站規則。
🔒Want to dive deeper? Check out my paid services below🔒
linktr.ee/ivanlabrie
linktr.ee/ivanlabrie
免責聲明
這些資訊和出版物並不意味著也不構成TradingView提供或認可的金融、投資、交易或其他類型的意見或建議。請在使用條款閱讀更多資訊。
開源腳本
本著TradingView的真正精神,此腳本的創建者將其開源,以便交易者可以查看和驗證其功能。向作者致敬!雖然您可以免費使用它,但請記住,重新發佈程式碼必須遵守我們的網站規則。
🔒Want to dive deeper? Check out my paid services below🔒
linktr.ee/ivanlabrie
linktr.ee/ivanlabrie
免責聲明
這些資訊和出版物並不意味著也不構成TradingView提供或認可的金融、投資、交易或其他類型的意見或建議。請在使用條款閱讀更多資訊。