OPEN-SOURCE SCRIPT
Failed 2D & Failed 2U Bars
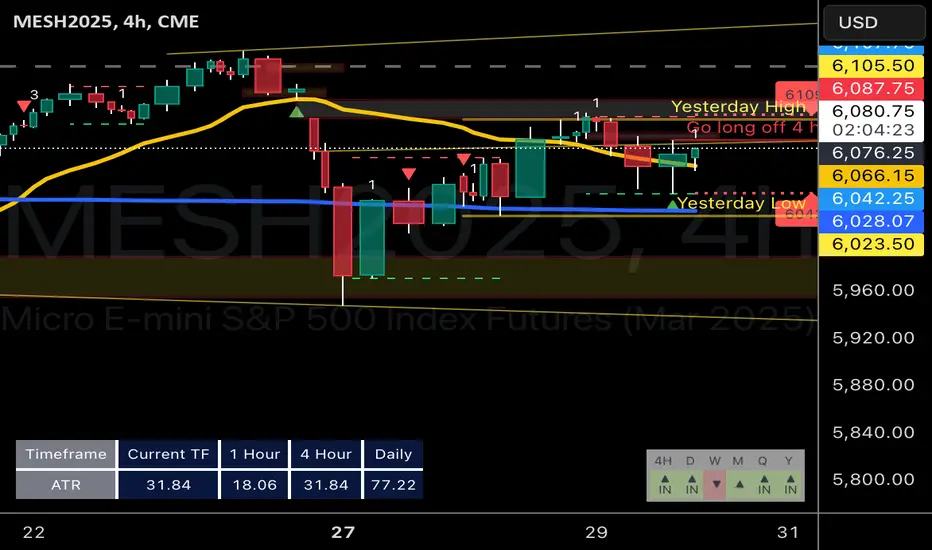
I created this indicator to plot a triangle when a candle is either 1) a failed 2 down--the candle breaks the low of the prior candle but closes green (or higher than its opening price) and doesn't break the high of the previous candle; and 2) a failed 2 up--high of the prior candle is broken but the bar is red and does not break the low of the prior candle.
It has alerts which you can set up in the alert system.
I think that this candle is one of the most telling and powerful when it comes to candle analysis.
R.I.P. Rob Smith, Creator of The Strat.
It has alerts which you can set up in the alert system.
I think that this candle is one of the most telling and powerful when it comes to candle analysis.
R.I.P. Rob Smith, Creator of The Strat.
開源腳本
本著TradingView的真正精神,此腳本的創建者將其開源,以便交易者可以查看和驗證其功能。向作者致敬!雖然您可以免費使用它,但請記住,重新發佈程式碼必須遵守我們的網站規則。
免責聲明
這些資訊和出版物並不意味著也不構成TradingView提供或認可的金融、投資、交易或其他類型的意見或建議。請在使用條款閱讀更多資訊。
開源腳本
本著TradingView的真正精神,此腳本的創建者將其開源,以便交易者可以查看和驗證其功能。向作者致敬!雖然您可以免費使用它,但請記住,重新發佈程式碼必須遵守我們的網站規則。
免責聲明
這些資訊和出版物並不意味著也不構成TradingView提供或認可的金融、投資、交易或其他類型的意見或建議。請在使用條款閱讀更多資訊。