INVITE-ONLY SCRIPT
KPV by Killpips
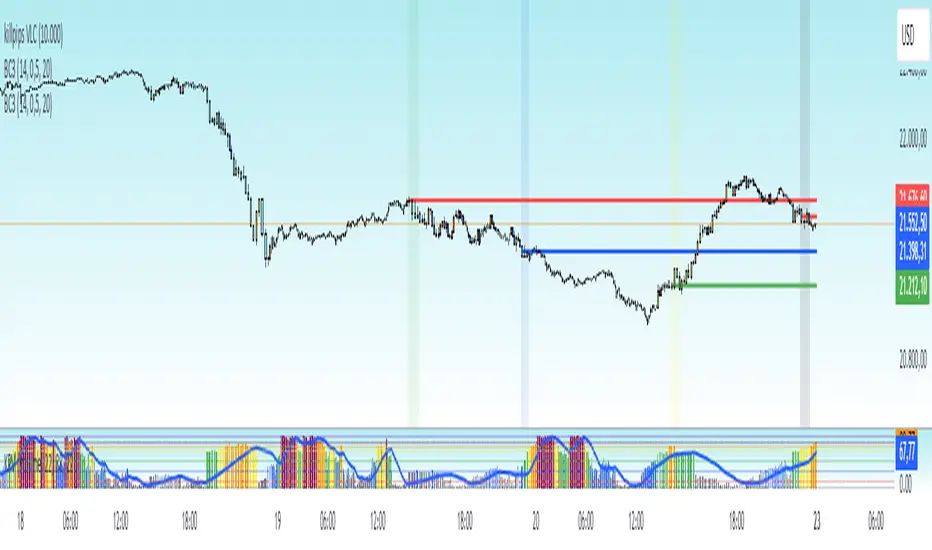
This Pine Script code is an indicator for the TradingView platform that calculates and plots volume percentiles over different time frames (daily, weekly, and monthly). It includes a volume percentile histogram.
Main Code Logic:
Historical Volatility (hvv):
The fHV function is called to calculate the volatility for the logarithmic volume values.
Volume Percentile (hvvp):
The fHVP function calculates the volume percentile based on the calculated historical volatility (hvv).
Percentile Ranks:
prv: The percentile rank of the volume percentile (hvvp) over the last avg periods (to represent the average volume percentile).
prv_1week: The percentile rank of the volume percentile over the last 5 times the avg period (to represent the weekly volume percentile, assuming 5 trading days in a week).
prv_1month: The percentile rank of the volume percentile over the last 22 times the avg period (to represent the monthly volume percentile, assuming 22 trading days in a month).
Volume Percentile Histogram (VV):
The VV variable represents the current value of the volume percentile (hvvp), which is plotted as a histogram. The color of the bars changes depending on the value of VV:
Maroon if above 90
Orange if between 80 and 90
Yellow if between 71 and 79
Green if between 50 and 70
Blu if between 49 and 31
Gray if below 30
僅限邀請腳本
僅作者批准的使用者才能訪問此腳本。您需要申請並獲得使用許可,通常需在付款後才能取得。更多詳情,請依照作者以下的指示操作,或直接聯絡killpips。
請注意,此私人、僅限受邀使用者使用的腳本未經腳本審核員審核,其是否符合社群規範尚待確定。 TradingView不建議在未完全信任作者並了解其運作方式的情況下購買或使用腳本。您也可以在我們的社群腳本中找到免費的開源替代方案。
作者的說明
Main Code Logic:
Historical Volatility (hvv):
The fHV function is called to calculate the volatility for the logarithmic volume values.
Volume Percentile (hvvp):
The fHVP function calculates the volume percentile based on the calculated historical vola
“A winner is just a man who never gave up.”
免責聲明
這些資訊和出版物並非旨在提供,也不構成TradingView提供或認可的任何形式的財務、投資、交易或其他類型的建議或推薦。請閱讀使用條款以了解更多資訊。