OPEN-SOURCE SCRIPT
Daily Levels (Open, Prev High/Low)
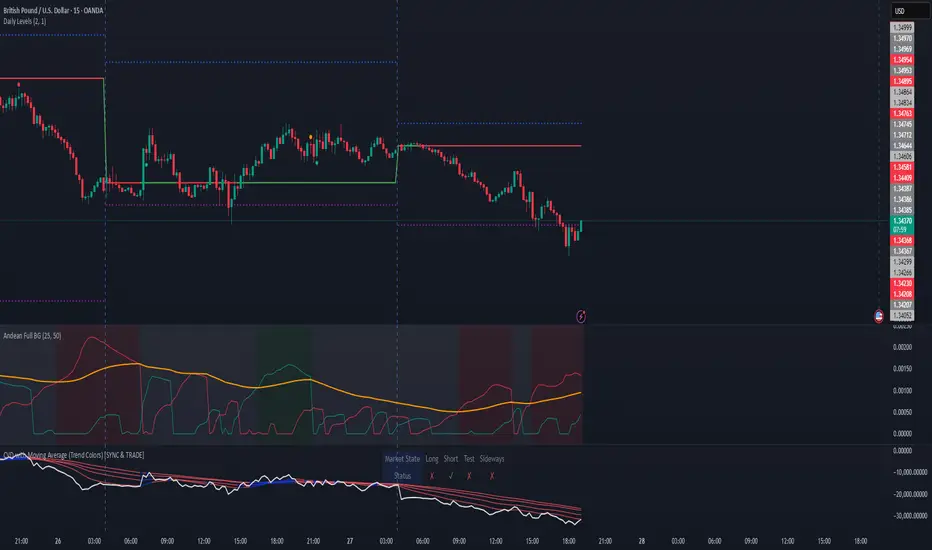
A clean and lightweight indicator that automatically plots three key intraday levels: the Daily Open, the Previous Day's High (PDH), and the Previous Day's Low (PDL). Essential for identifying potential support, resistance, and daily market bias without cluttering your chart.
Overview
This indicator is designed to be a simple yet powerful tool for intraday traders. It automatically draws three of the most significant price levels that traders watch every day:
By having these levels plotted automatically, you can keep your charts clean and focus on your strategy instead of manually drawing lines every new trading session.
Key Features
Dynamic Daily Open Line: This line represents the opening price of the current session. It dynamically changes color to give you an at-a-glance view of the daily sentiment.
Green: Current price is trading above the daily open (Bullish sentiment).
Red: Current price is trading below the daily open (Bearish sentiment).
Gray: Current price is at the open.
Previous Day's High (PDH): A line marking the highest price reached during the prior trading session. This level frequently acts as a key resistance point.
Previous Day's Low (PDL): A line marking the lowest price reached during the prior trading session. This level often serves as a key support area.
How to Use This Indicator
These levels are fundamental to many intraday trading strategies:
Identify Support & Resistance: Use PDH and PDL as natural areas to watch for price reactions. A break above PDH can signal strong bullish momentum, while a break below PDL can indicate strong bearish momentum.
Gauge Market Bias: Trading above the Daily Open is often considered bullish for the day, while trading below it is considered bearish. This can help you filter trades to align with the dominant intraday trend.
Set Entries & Exits: Look for confirmation signals (like candlestick patterns or other indicator signals) when the price interacts with these levels. They can also be logical areas for placing stop-losses or take-profit targets.
Customization
The indicator is fully customizable to fit your charting style:
Toggle the visibility of the Daily Open and the PDH/PDL lines.
Adjust the colors and line widths for each level.
This tool helps you stay focused on the levels that matter most for day trading.
Overview
This indicator is designed to be a simple yet powerful tool for intraday traders. It automatically draws three of the most significant price levels that traders watch every day:
- The Current Day's Opening Price
- The Previous Day's High (PDH)
- The Previous Day's Low (PDL)
By having these levels plotted automatically, you can keep your charts clean and focus on your strategy instead of manually drawing lines every new trading session.
Key Features
Dynamic Daily Open Line: This line represents the opening price of the current session. It dynamically changes color to give you an at-a-glance view of the daily sentiment.
Green: Current price is trading above the daily open (Bullish sentiment).
Red: Current price is trading below the daily open (Bearish sentiment).
Gray: Current price is at the open.
Previous Day's High (PDH): A line marking the highest price reached during the prior trading session. This level frequently acts as a key resistance point.
Previous Day's Low (PDL): A line marking the lowest price reached during the prior trading session. This level often serves as a key support area.
How to Use This Indicator
These levels are fundamental to many intraday trading strategies:
Identify Support & Resistance: Use PDH and PDL as natural areas to watch for price reactions. A break above PDH can signal strong bullish momentum, while a break below PDL can indicate strong bearish momentum.
Gauge Market Bias: Trading above the Daily Open is often considered bullish for the day, while trading below it is considered bearish. This can help you filter trades to align with the dominant intraday trend.
Set Entries & Exits: Look for confirmation signals (like candlestick patterns or other indicator signals) when the price interacts with these levels. They can also be logical areas for placing stop-losses or take-profit targets.
Customization
The indicator is fully customizable to fit your charting style:
Toggle the visibility of the Daily Open and the PDH/PDL lines.
Adjust the colors and line widths for each level.
This tool helps you stay focused on the levels that matter most for day trading.
開源腳本
本著TradingView的真正精神,此腳本的創建者將其開源,以便交易者可以查看和驗證其功能。向作者致敬!雖然您可以免費使用它,但請記住,重新發佈程式碼必須遵守我們的網站規則。
免責聲明
這些資訊和出版物並不意味著也不構成TradingView提供或認可的金融、投資、交易或其他類型的意見或建議。請在使用條款閱讀更多資訊。
免責聲明
這些資訊和出版物並不意味著也不構成TradingView提供或認可的金融、投資、交易或其他類型的意見或建議。請在使用條款閱讀更多資訊。