OPEN-SOURCE SCRIPT
Buy/Sell Pressure Raw
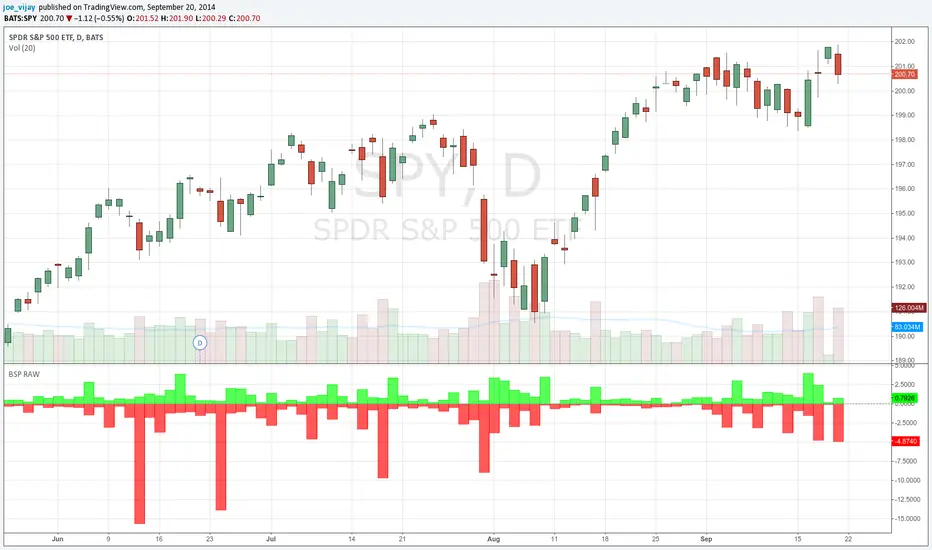
// This is a port of the bar by bar Buy/Sell pressure indicator by Karthik Marar.
// See below link for further details.
// karthikmarar.blogspot.com/2012/09/buying-and-selling-pressure-indicator.html
// The only difference being I used the Hull moving average instead of WMA which the HullMA is a derivative of.
// Credits to Chris Moody for the HullMA code.
// All disclaimers apply
開源腳本
本著TradingView的真正精神,此腳本的創建者將其開源,以便交易者可以查看和驗證其功能。向作者致敬!雖然您可以免費使用它,但請記住,重新發佈程式碼必須遵守我們的網站規則。
免責聲明
這些資訊和出版物並不意味著也不構成TradingView提供或認可的金融、投資、交易或其他類型的意見或建議。請在使用條款閱讀更多資訊。
開源腳本
本著TradingView的真正精神,此腳本的創建者將其開源,以便交易者可以查看和驗證其功能。向作者致敬!雖然您可以免費使用它,但請記住,重新發佈程式碼必須遵守我們的網站規則。
免責聲明
這些資訊和出版物並不意味著也不構成TradingView提供或認可的金融、投資、交易或其他類型的意見或建議。請在使用條款閱讀更多資訊。