PROTECTED SOURCE SCRIPT
已更新 Combined Indicator - W (Optimized)
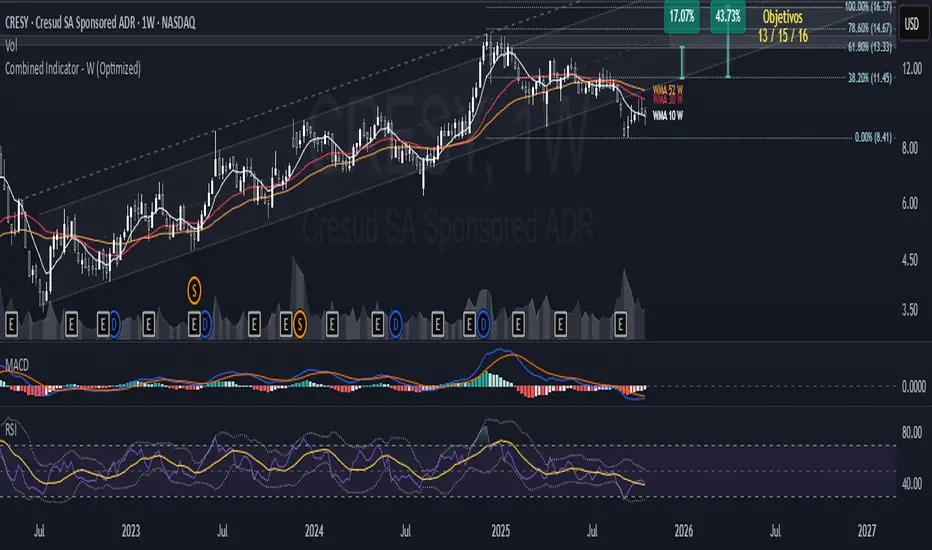
/ description This weekly-focused indicator combines multiple technical analysis tools optimized for weekly timeframes:
// - Weighted Moving Averages: WMA 10 (short-term), WMA 30 (medium-term), and WMA 52 (annual cycle)
// - Bollinger Bands: With configurable basis (SMA, EMA, WMA, etc.) and customizable standard deviation, default 30 periods
// - CAGR Calculation: Shows compound annual growth rate and total growth for the visible period
// WMA indicators provide responsive trend analysis suitable for weekly charts. The 52-period WMA represents annual cycles.
// Bollinger Bands indicate volatility and potential reversal zones. CAGR provides long-term performance perspective.
// Optimized for better performance with efficient calculations and reduced memory usage.
發行說明
weekly indicator受保護腳本
此腳本以閉源形式發佈。 不過,您可以自由使用,沒有任何限制 — 點擊此處了解更多。
免責聲明
這些資訊和出版物並非旨在提供,也不構成TradingView提供或認可的任何形式的財務、投資、交易或其他類型的建議或推薦。請閱讀使用條款以了解更多資訊。
受保護腳本
此腳本以閉源形式發佈。 不過,您可以自由使用,沒有任何限制 — 點擊此處了解更多。
免責聲明
這些資訊和出版物並非旨在提供,也不構成TradingView提供或認可的任何形式的財務、投資、交易或其他類型的建議或推薦。請閱讀使用條款以了解更多資訊。