INVITE-ONLY SCRIPT
SMC Mapping 2.0
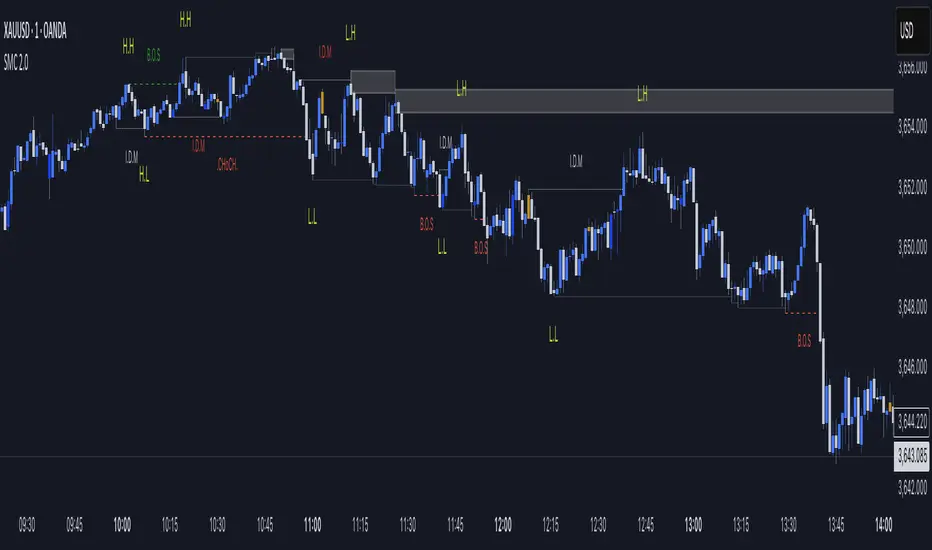
“This script is a Smart Money Concepts (SMC) indicator that helps traders identify market structure shifts such as Break of Structure (BOS) and Change of Character (ChoCH). It also highlights Supply & Demand zones, Internal/External Liquidity sweeps, and IDM levels.
The tool is designed for price action traders who want a clean and visual way to track BOS, ChoCH, and liquidity points directly on their chart. It is fully customizable with options to show/hide different elements, change colors, and adjust sensitivity.”
🔹 Script Overview
This script is based on Smart Money Concepts (SMC).
It automatically identifies Break of Structure (BOS), Change of Character (ChoCH), Supply & Demand zones, and IDM zones on the chart.
🔹 Features
Market Structure Detection → plots HH (Higher Highs) and LL (Lower Lows)
BOS & ChoCH → quickly identify trend shifts
Auto Supply & Demand Zones → highlights potential reversal areas
IDM Zones → marks imbalance/inefficiency
Clear color-coded visuals for bullish/bearish context
🔹 How It Works
The script evaluates recent swing highs and lows (20-bar lookback by default)
When price breaks above the recent high → Bullish BOS
When price breaks below the recent low → Bearish BOS
Based on this structure, the script automatically generates labels and zones
🔹 How To Use
Add the script to your chart (works well on 15m, 1H, 4H timeframes)
Use HH/LL labels to read the market structure
Supply & Demand zones help in identifying possible entry/exit points
IDM zones confirm imbalance areas for trade validation
🔹 Note
While this script uses classic concepts (HH, LL, Supply/Demand, IDM), the calculations, visuals, and styling are customized to provide a fresh and unique tool for traders. It is designed to help traders clearly see market structure and plan trades accordingly.
僅限邀請腳本
僅作者批准的使用者才能訪問此腳本。您需要申請並獲得使用許可,通常需在付款後才能取得。更多詳情,請依照作者以下的指示操作,或直接聯絡JacK-7。
TradingView不建議在未完全信任作者並了解其運作方式的情況下購買或使用腳本。您也可以在我們的社群腳本中找到免費的開源替代方案。
作者的說明
Please note: This tool is for educational purposes only. Use it with your own analysis and risk management.
To request access, please visit my TradingView profile and click on the “Send Message” button.
Access is granted at the author’s discretion.
免責聲明
這些資訊和出版物並非旨在提供,也不構成TradingView提供或認可的任何形式的財務、投資、交易或其他類型的建議或推薦。請閱讀使用條款以了解更多資訊。