INVITE-ONLY SCRIPT
Wizard Dynamic EMA Table
Purpose of the Script
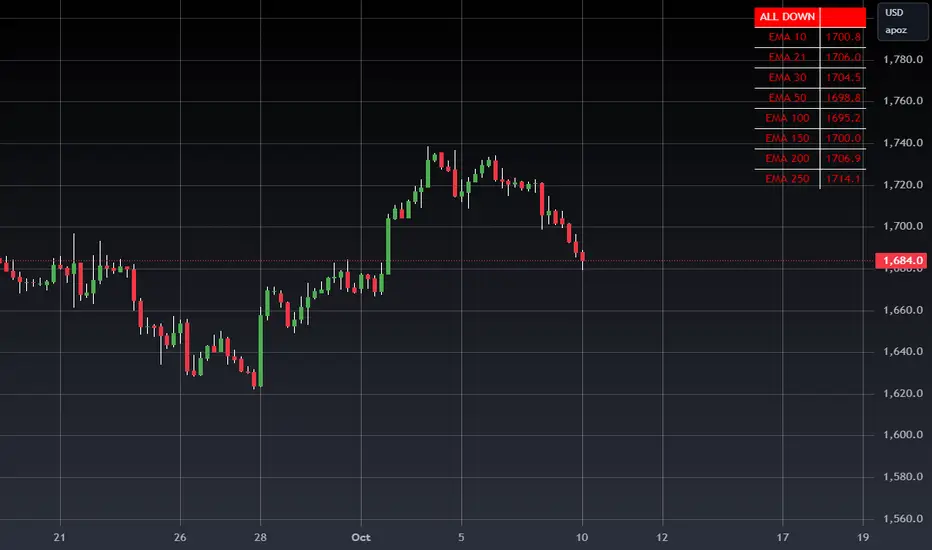
Track Multiple EMAs:
Displays 8 EMAs with their respective values.
Indicates whether each EMA is trending upward (green) or downward (red).
Summary Indicator:
A top cell provides a quick, overall trend:
Green ("ALL UP"): All EMAs are trending upward.
Red ("ALL DOWN"): All EMAs are trending downward.
Gray ("MIXED"): Some EMAs are up, and some are down.
Customizable:
The user can configure EMA periods to match their trading strategy.
Click Add to Chart (top-right corner of the Pine Editor).
The dashboard will appear on your chart.
How to Use the Dashboard
Monitor EMAs:
Look at the EMA table for real-time updates on each EMA's value and trend (up or down).
Quick Market Trend Analysis:
Check the summary cell at the top:
ALL UP (Green): Strong upward trend across all monitored EMAs.
ALL DOWN (Red): Strong downward trend across all monitored EMAs.
MIXED (Gray): Market is indecisive or ranging.
Customize EMA Periods:
Adjust the EMA periods from the script's settings:
Click the gear icon on the indicator in the chart legend.
Modify the EMA periods to match your trading strategy (e.g., 21, 50, 100, etc.).
Apply to Any Asset:
Use this script for any asset (stocks, forex, crypto, futures) available on TradingView.
Trading Strategies with the Dashboard
Trend-Following Strategy:
If the summary cell shows ALL UP, consider looking for long opportunities.
If the summary cell shows ALL DOWN, consider looking for short opportunities.
Reversal Strategy:
When the summary changes from ALL UP to MIXED or ALL DOWN, it might signal a weakening uptrend or potential reversal.
Confluence with Other Indicators:
Apply the dashboard to any timeframe (e.g., 1-minute, 1-hour, daily) depending on your trading style.
Benefits of Using This Script
Saves Time:
Quickly analyze trends across multiple EMAs without manually calculating or interpreting each one.
Visual Clarity:
The color-coded table provides instant insights into market conditions.
Customizable:
Tailor the EMA periods and apply it to any asset or timeframe.
"Disclaimer: This indicator is intended for educational purposes only and does not constitute financial advice. Trading involves significant risk, and users should perform their own research and consult with a licensed financial advisor before making any trading decisions."
僅限邀請腳本
僅作者批准的使用者才能訪問此腳本。您需要申請並獲得使用許可,通常需在付款後才能取得。更多詳情,請依照作者以下的指示操作,或直接聯絡WIZARDTRENDS。
請注意,此私人、僅限受邀使用者使用的腳本未經腳本審核員審核,其是否符合社群規範尚待確定。 TradingView不建議在未完全信任作者並了解其運作方式的情況下購買或使用腳本。您也可以在我們的社群腳本中找到免費的開源替代方案。
作者的說明
FEEL FREE TO REACH US
免責聲明
這些資訊和出版物並非旨在提供,也不構成TradingView提供或認可的任何形式的財務、投資、交易或其他類型的建議或推薦。請閱讀使用條款以了解更多資訊。