IldarAkhmetgaleev

Market Effectivity area v1

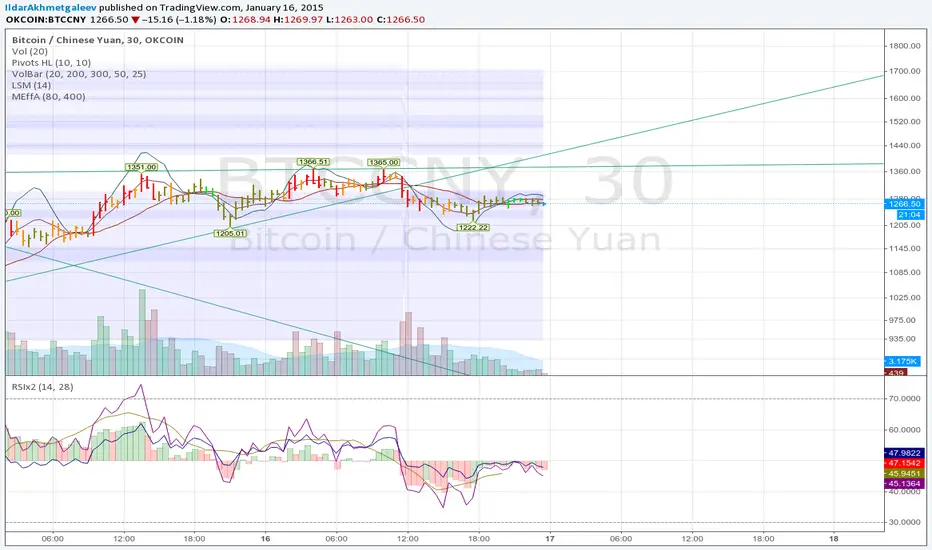
Cheap horizontal levels on chart

idea is: When spread is low and volume is high, then price is well accepted and will be retested in future. Areas without such "market efficiency" will be passed fast without stopping or rejected.
開源腳本

本著真正的TradingView精神,該腳本的作者將其開源發布,以便交易者可以理解和驗證它。為作者喝彩吧!您可以免費使用它,但在出版物中重複使用此代碼受網站規則的約束。 您可以收藏它以在圖表上使用。

免責聲明

這些資訊和出版物並不意味著也不構成TradingView提供或認可的金融、投資、交易或其他類型的意見或建議。請在使用條款閱讀更多資訊。

想在圖表上使用此腳本?
study(title="Market Effectivity area", shorttitle="MEffA", overlay=true)
std_len = input(80, minval=5, title='Deviation lenght')
thresshold = input(400, minval=100, title='Thresshold') / 100

line_color = #eeeeff
area_color = #7777ff
area_transp = 87

highvol = volume > stdev(volume, std_len) * thresshold
top = highvol ? high : top[1]
bottom = highvol ? low : bottom[1]

tl = plot(top, color=line_color, style=circles)
bl = plot(bottom, color=line_color, style=circles)
fill(tl, bl, color=area_color, transp=area_transp)

// echo
t_1 = top[1] != top ? top[1] : t_1[1]
b_1 = bottom[1] != bottom ? bottom[1] : b_1[1]
tl_1 = plot(t_1, color=line_color, style=circles)
bl_1 = plot(b_1, color=line_color, style=circles)
fill(tl_1, bl_1, color=area_color, transp=area_transp+1)

t_2 = t_1[1] != t_1 ? t_1[1] : t_2[1]
b_2 = b_1[1] != b_1 ? b_1[1] : b_2[1]
tl_2 = plot(t_2, color=line_color, style=circles)
bl_2 = plot(b_2, color=line_color, style=circles)
fill(tl_2, bl_2, color=area_color, transp=area_transp+1)

t_3 = t_2[1] != t_2 ? t_2[1] : t_3[1]
b_3 = b_2[1] != b_2 ? b_2[1] : b_3[1]
tl_3 = plot(t_3, color=line_color, style=circles)
bl_3 = plot(b_3, color=line_color, style=circles)
fill(tl_3, bl_3, color=area_color, transp=area_transp+2)

t_4 = t_3[1] != t_3 ? t_3[1] : t_4[1]
b_4 = b_3[1] != b_3 ? b_3[1] : b_4[1]
tl_4 = plot(t_4, color=line_color, style=circles)
bl_4 = plot(b_4, color=line_color, style=circles)
fill(tl_4, bl_4, color=area_color, transp=area_transp+2)

t_5 = t_4[1] != t_4 ? t_4[1] : t_5[1]
b_5 = b_4[1] != b_4 ? b_4[1] : b_5[1]
tl_5 = plot(t_5, color=line_color, style=circles)
bl_5 = plot(b_5, color=line_color, style=circles)
fill(tl_5, bl_5, color=area_color, transp=area_transp+3)

t_6 = t_5[1] != t_5 ? t_5[1] : t_6[1]
b_6 = b_5[1] != b_5 ? b_5[1] : b_6[1]
tl_6 = plot(t_6, color=line_color, style=circles)
bl_6 = plot(b_6, color=line_color, style=circles)
fill(tl_6, bl_6, color=area_color, transp=area_transp+3)

t_7 = t_6[1] != t_6 ? t_6[1] : t_7[1]
b_7 = b_6[1] != b_6 ? b_6[1] : b_7[1]
tl_7 = plot(t_7, color=line_color, style=circles)
bl_7 = plot(b_7, color=line_color, style=circles)
fill(tl_7, bl_7, color=area_color, transp=area_transp+4)

t_8 = t_7[1] != t_7 ? t_7[1] : t_8[1]
b_8 = b_7[1] != b_7 ? b_7[1] : b_8[1]
tl_8 = plot(t_8, color=line_color, style=circles)
bl_8 = plot(b_8, color=line_color, style=circles)
fill(tl_8, bl_8, color=area_color, transp=area_transp+4)

t_9 = t_8[1] != t_8 ? t_8[1] : t_9[1]
b_9 = b_8[1] != b_8 ? b_8[1] : b_9[1]
tl_9 = plot(t_9, color=line_color, style=circles)
bl_9 = plot(b_9, color=line_color, style=circles)
fill(tl_9, bl_9, color=area_color, transp=area_transp+5)

t_10 = t_9[1] != t_9 ? t_9[1] : t_10[1]
b_10 = b_9[1] != b_9 ? b_9[1] : b_10[1]
tl_10 = plot(t_10, color=line_color, style=circles)
bl_10 = plot(b_10, color=line_color, style=circles)
fill(tl_10, bl_10, color=area_color, transp=area_transp+5)

t_11 = t_10[1] != t_10 ? t_10[1] : t_11[1]
b_11 = b_10[1] != b_10 ? b_10[1] : b_11[1]
tl_11 = plot(t_11, color=line_color, style=circles)
bl_11 = plot(b_11, color=line_color, style=circles)
fill(tl_11, bl_11, color=area_color, transp=area_transp+6)

t_12 = t_11[1] != t_11 ? t_11[1] : t_12[1]
b_12 = b_11[1] != b_11 ? b_11[1] : b_12[1]
tl_12 = plot(t_12, color=line_color, style=circles)
bl_12 = plot(b_12, color=line_color, style=circles)
fill(tl_12, bl_12, color=area_color, transp=area_transp+6)