INVITE-ONLY SCRIPT
DBT MoMo Divergence Finder
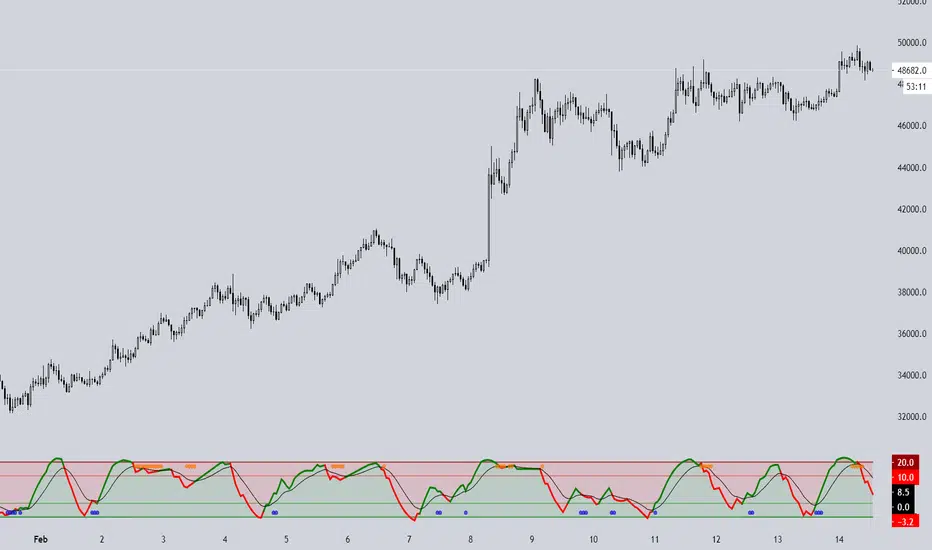
This Indicator is an experimental Divergence Finder using the DBT MoMo formula. See DBT MoMo v.4 for details on the main script.
https://www.tradingview.com/script/t57XmNGo-DBT-MoMo-v-4/
It uses a slower version of the DBT MoMo Price Line to smooth out the trend and color codes the Price Line based on its trend.
Bullish Divergence is denoted by Blue Labels below the Price Line.
Bearish Divergence is denoted by Orange Labels above the Price Line.
Alerts can be setup in Tradingview for both Bullish and Bearish Divergence Signals.
This indicator is brand new and experimental, make sure to double check the Divergence Alerts before blindly trading them. There can be a mathematical divergence without there being a visual divergence, this will trigger a false alert.
Everyone with access to the DBT MoMo will have access to this indicator as well.
僅限邀請腳本
僅作者批准的使用者才能訪問此腳本。您需要申請並獲得使用許可,通常需在付款後才能取得。更多詳情,請依照作者以下的指示操作,或直接聯絡OasisTrading。
TradingView不建議在未完全信任作者並了解其運作方式的情況下購買或使用腳本。您也可以在我們的社群腳本中找到免費的開源替代方案。
作者的說明
Website
oasistrading.io
Meet the Team.
twitter.com/DejaBrewTrades
tradingview.com/u/gyromatical/
oasistrading.io
Meet the Team.
twitter.com/DejaBrewTrades
tradingview.com/u/gyromatical/
免責聲明
這些資訊和出版物並非旨在提供,也不構成TradingView提供或認可的任何形式的財務、投資、交易或其他類型的建議或推薦。請閱讀使用條款以了解更多資訊。